

PL-300 Practice Questions Free – 50 Exam-Style Questions to Sharpen Your Skills
Are you preparing for the PL-300 certification exam? Kickstart your success with our PL-300 Practice Questions Free – a carefully selected set of 50 real exam-style questions to help you test your knowledge and identify areas for improvement.
Practicing with PL-300 practice questions free gives you a powerful edge by allowing you to:
- Understand the exam structure and question formats
- Discover your strong and weak areas
- Build the confidence you need for test day success
Below, you will find 50 free PL-300 practice questions designed to match the real exam in both difficulty and topic coverage. They’re ideal for self-assessment or final review. You can click on each Question to explore the details.
Note: This question is part of a series of questions that present the same scenario. Each question in the series contains a unique solution that might meet the stated goals. Some question sets might have more than one correct solution, while others might not have a correct solution.
After you answer a question in this section, you will NOT be able to return to it. As a result, these questions will not appear in the review screen.
You have a Power BI report that imports a date table and a sales table from an Azure SQL database data source. The sales table has the following date foreign keys:
✑ Due Date
✑ Order Date
✑ Delivery Date
You need to support the analysis of sales over time based on all the date foreign keys.
Solution: For each date foreign key, you add inactive relationships between the sales table and the date table.
Does this meet the goal?
A. Yes
B. No
A business intelligence (BI) developer creates a dataflow in Power BI that uses DirectQuery to access tables from an on-premises Microsoft SQL server. The
Enhanced Dataflows Compute Engine is turned on for the dataflow.
You need to use the dataflow in a report. The solution must meet the following requirements:
✑ Minimize online processing operations.
✑ Minimize calculation times and render times for visuals.
✑ Include data from the current year, up to and including the previous day.
What should you do?
A. Create a dataflows connection that has DirectQuery mode selected.
B. Create a dataflows connection that has DirectQuery mode selected and configure a gateway connection for the dataset.
C. Create a dataflows connection that has Import mode selected and schedule a daily refresh.
D. Create a dataflows connection that has Import mode selected and create a Microsoft Power Automate solution to refresh the data hourly.
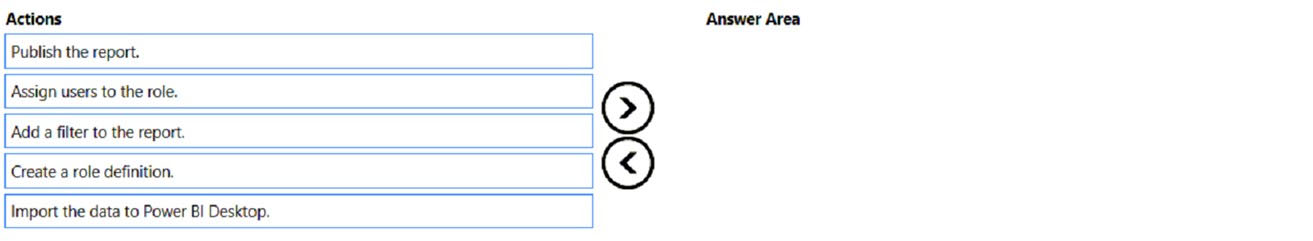
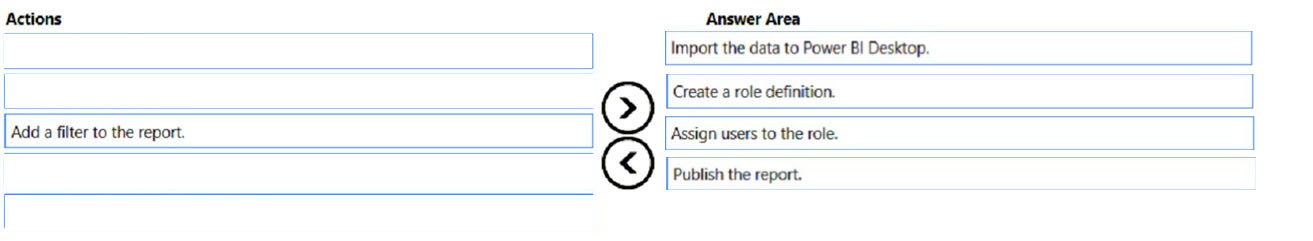
DRAG DROP -
You plan to create a report that will display sales data from the last year for multiple regions.
You need to restrict access to individual rows of the data on a per region-basis by using roles.
Which four actions should you perform in sequence? To answer, move the appropriate actions from the list of actions to the answer area and arrange them in the correct order.
Select and Place:
You have the CSV file shown in the following table.You use Power Query Editor to preview the data in the file. You need to transform the data to meet the following requirements: • The first column must contain the month. • The second column must contain the year. • The third column must contain the order amount for the month and year. Which transformation should you use first?
A. remove
B. unpivot
C. transpose
D. pivot
You have a CSV file that contains user complaints. The file contains a column named Logged. Logged contains the date and time each complaint occurred. The data in Logged is in the following format: 2018-12-31 at 08:59.
You need to be able to analyze the complaints by the logged date and use a built-in date hierarchy.
What should you do?
A. Change the data type of the Logged column to Date.
B. Split the Logged column by using at as the delimiter.
C. Add a conditional column that outputs 2018 if the Logged column starts with 2018 and set the data type of the new column to Whole Number.
D. Apply the Parse function from the Date transformations options to the Logged column.
After you answer a question in this section, you will NOT be able to return to it. As a result, these questions will not appear in the review screen.
You have five reports and two dashboards in a workspace.
You need to grant all organizational users read access to one dashboard and three reports.
Solution: You enable included in app for all assets.
Does this meet the goal?
A. Yes
B. No
After you answer a question in this section, you will NOT be able to return to it. As a result, these questions will not appear in the review screen.
You have a clustered bar chart that contains a measure named Salary as the value and a field named Employee as the axis. Salary is present in the data as a numerical amount representing US dollars.
You need to create a reference line to show which employees are above the median salary.
Solution: You create a median line by using the Salary measure.
Does this meet the goal?
A. Yes
B. No
Note: This question is part of a series of questions that present the same scenario. Each question in the series contains a unique solution that might meet the stated goals. Some question sets might have more than one correct solution, while others might not have a correct solution.
After you answer a question in this section, you will NOT be able to return to it. As a result, these questions will not appear in the review screen.
You have a Power BI report that imports a date table and a sales table from an Azure SQL database data source. The sales table has the following date foreign keys:
• Due Date
• Order Date
• Delivery Date
You need to support the analysis of sales over time based on all three dates at the same time.
Solution: From the Fields pane, you rename the date table as Due Date. You use a DAX expression to create Order Date and Delivery Date as calculated tables. You create active relationships between the sales table and each date table.
Does this meet the goal?
A. Yes
B. No
Note: This question is part of a series of questions that present the same scenario. Each question in the series contains a unique solution that might meet the stated goals. Some question sets might have more than one correct solution, while others might not have a correct solution.
After you answer a question in this section, you will NOT be able to return to it. As a result, these questions will not appear in the review screen.
You have five reports and two dashboards in a workspace.
You need to grant all organizational users read access to one dashboard and three reports.
Solution: You assign all the users the Viewer role to the workspace.
Does this meet the goal?
A. Yes
B. No
You are building a data model for a Power BI report. You have data formatted as shown in the following table.You need to create a clustered bar chart as shown in the following exhibit.
What should you do?
A. From Power Query Editor, split the Machine-User column by using a delimiter.
B. From Power Query Editor, create a column that contains the last three digits of the Machine-User column.
C. In a DAX function, create two calculated columns named Machine and User by using the SUBSTITUTE function.
D. In a DAX function, create two measures named Machine and User by using the SUBSTITUTE function.
After you answer a question in this section, you will NOT be able to return to it. As a result, these questions will not appear in the review screen.
You are modeling data by using Microsoft Power BI. Part of the data model is a large Microsoft SQL Server table named Order that has more than 100 million records.
During the development process, you need to import a sample of the data from the Order table.
Solution: You add a report-level filter that filters based on the order date.
Does this meet the goal?
A. Yes
B. No
HOTSPOT - You attempt to use Power Query Editor to create a custom column and receive the error message shown in the following exhibit.Use the drop-down menus to select the answer choice that completes each statement based on the information presented in the graphic. NOTE: Each correct selection is worth one point.


After you answer a question in this section, you will NOT be able to return to it. As a result, these questions will not appear in the review screen.
You are modeling data by using Microsoft Power BI. Part of the data model is a large Microsoft SQL Server table named Order that has more than 100 million records.
During the development process, you need to import a sample of the data from the Order table.
Solution: You write a DAX expression that uses the FILTER function.
Does this meet the goal?
A. Yes
B. No
You need to provide a solution to provide the sales managers with the required access.
What should you include in the solution?
A. Create a security role that has a table filter on the Sales Manager table where username = UserName().
B. Create a security role that has a table filter on the Sales Manager table where username = sales_manager_id.
C. Create a security role that has a table filter on the Region Manager table where sales_manager_id = UserPrincipalName().
D. Create a security role that has a table filter on the Sales_Manager table where name = UserName().
You have a project management app that is fully hosted in Microsoft Teams. The app was developed by using Microsoft Power Apps.
You need to create a Power BI report that connects to the project management app.
Which connector should you select?
A. Microsoft Teams Personal Analytics
B. SQL Server database
C. Dataverse
D. Dataflows
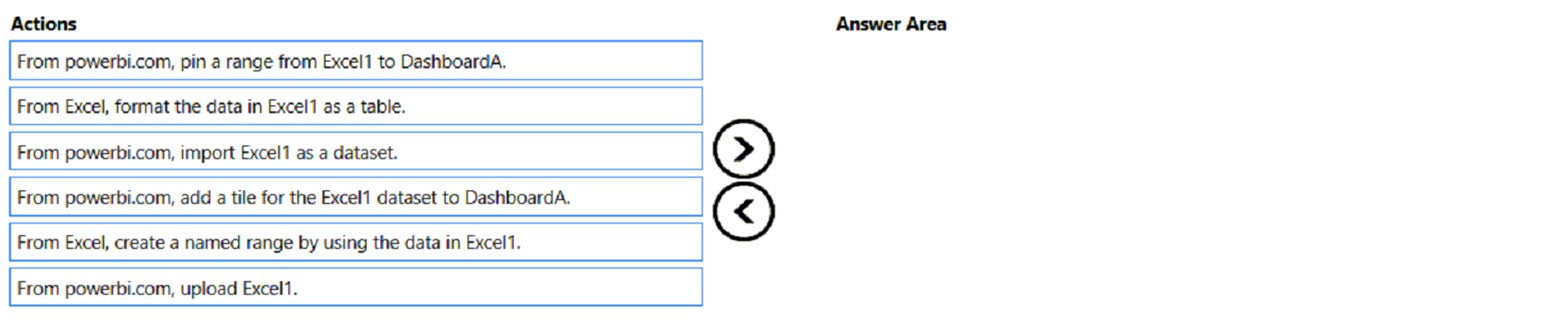
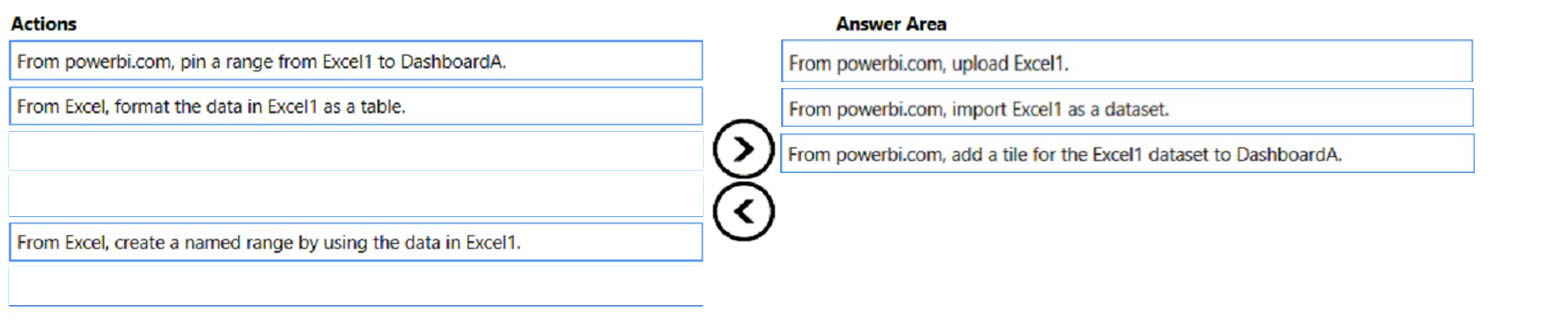
DRAG DROP -
You have a Microsoft Excel spreadsheet named Excel1 that contains survey results.
You have a Power BI dashboard named DashboardA that has Q&A enabled.
You need to ensure that users who can access DashboardA can ask questions based on the contents of Excel1 and pin visuals based on their queries to
DashboardA. The solution must minimize development time.
Which three actions should you perform in sequence? To answer, move the appropriate actions from the list of actions to the answer area and arrange them in the correct order.
Select and Place:
You need to create a calculated column to display the month based on the reporting requirements.
Which DAX expression should you use?
A. FORMAT(‘Date'[date],”MMM YYYY”)
B. FORMAT(‘Date'[date_id],”MMM”) & ” ” & FORMAT(‘Date'[year], “#”)
C. FORMAT(‘Date'[date_id],”MMM YYYY”)
D. FORMAT(‘Date'[date],”M YY”)
You have a Power BI report that contains three pages named Page1, Page2, and Page3. All the pages have the same slicers.
You need to ensure that all the filters applied to Page1 apply to Page1 and Page3 only.
What should you do?
A. On each page, modify the interactions of the slicer.
B. Enable visibility of the slicers on Page1 and Page3. Disable visibility of the slicer on Page2.
C. Sync the slicers on Page1 and Page3.
Overview - Contoso, Ltd. is a manufacturing company that produces sports equipment. Contoso holds quarterly board meetings for which financial analysts manually prepare Microsoft Excel reports, including balance sheets and profit and loss statements for each of the company's four business units. Existing Environment - Data and Sources - Data for the reports comes from the sources shown in the following table.The balance sheet data is unrelated to the profit and loss results other than they both relate to dates. Balance Sheet Data - The balance sheet data is imported and includes the final monthly balances of each account in the format shown in the following table.
The balance sheet data always includes a row for each account for each month. Product Catalog Data - The product catalog shows how products roll up to product categories, which roll up to the business units. The product list is provided in the format shown in the following table.
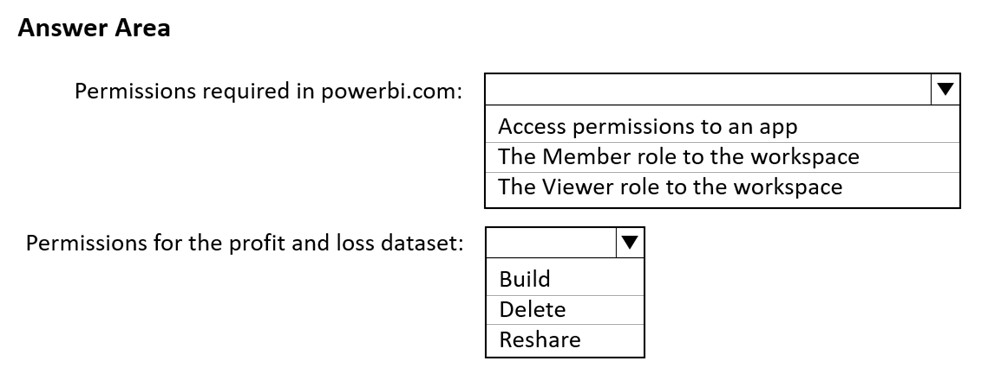
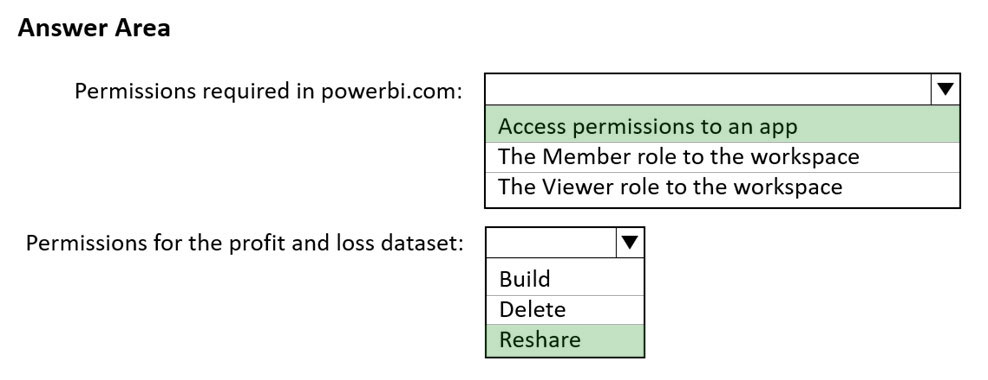
Revenue data is provided at the date and product level. Expense data is provided at the date and department level. Business Issues - Historically, it has taken two analysts a week to prepare the reports for the quarterly board meetings. Also, there is usually at least one issue each quarter where a value in a report is wrong because of a bad cell reference in an Excel formula. On occasion, there are conflicting results in the reports because the products and departments that roll up to each business unit are not defined consistently. Requirements - Planned Changes - Contoso plans to automate and standardize the quarterly reporting process by using Power BI. The company wants to reduce how long it takes to populate the reports to less than two days. The company wants to create common logic for the business units, products, and departments. The logic will be used across all reports, including but not limited to the quarterly reporting for the board. Technical Requirements - Contoso wants the reports and datasets refreshed with minimum manual effort. The company wants to provide the board with a single package of reports that will contain custom navigation and links to supplementary information. Maintenance, including manually updating data and access, must be minimized as much as possible. Security Requirements - The reports must be made available to the board from powerbi.com. An Azure Active Directory (Azure AD) group will be used to share information with the board. Contoso identifies the following security requirements for analyst access: Analysts must be able to access all balance sheet and product catalog data. Analysts must be able to access only the profit and loss data of their respective business unit. Analysts must be able to create new reports from the dataset that contains the profit and loss data, but the reports built by the analysts must NOT be included in the quarterly reports for the board. Analysts must NOT be able to share the quarterly reports with anyone. Analysts must NOT be able to make new reports by using the balance sheet data. Report Requirements - You plan to relate the balance sheet table to a date table in Power BI in a many-to-one relationship based on the last day of the month. At least one of the balance sheet reports in the quarterly reporting package must show the ending balances for the quarter, as well as for the previous quarter. The date table will contain the columns shown in the following table.
The definitions and attributes for the products, departments, and business units must be consistent across all the reports. The board must be able to get the following information from the quarterly reports: Revenue trends over time The ending balances of each account Changes in long-term liabilities from the previous quarter The percent of total revenue contributed by each product category A comparison of quarterly revenue versus the same quarter from the previous year
The reports must be updated with the latest data by 5 AM each day. HOTSPOT - You need to grant access to the business unit analysts. What should you configure? To answer, select the appropriate options in the answer area. NOTE: Each correct selection is worth one point. Hot Area:
You have a Power BI dashboard that monitors the quality of manufacturing processes. The dashboard contains the following elements:
✑ A line chart that shows the number of defective products manufactured by day
✑ A KPI visual that shows the current daily percentage of defective products manufactured
You need to be notified when the daily percentage of defective products manufactured exceeds 3%.
What should you create?
A. a subscription
B. an alert
C. a smart narrative visual
D. a Q&A visual
You use Power Query Editor to preview a query that contains sales order data in the following columns:
• Tax Amount
• Sales Order ID
• Freight Amount
• Subtotal Amount
• Total Item Quantity
The Sales Order ID column uniquely identifies each sales order. The Subtotal Amount and Total Item Quantity columns are always populated, but the Tax Amount and Freight Amount columns are sometimes null when an order has no associated amount.
You need to query the data to identify the following metrics by month:
• The average item quantity per order
• The average freight amount per order
• The maximum item quantity per order
How should you modify the query?
A. In the Total Item Quantity column, replace the null values with 0.
B. In the Tax Amount column, remove rows that contain null values.
C. In the Freight Amount column, remove rows that contain null values.
D. In the Freight Amount column, replace the null values with 0.
You have a Microsoft Power BI report. The size of PBIX file is 550 MB. The report is accessed by using an App workspace in shared capacity of powerbi.com.
The report uses an imported dataset that contains one fact table. The fact table contains 12 million rows. The dataset is scheduled to refresh twice a day at 08:00 and 17:00.
The report is a single page that contains 15 AppSource visuals and 10 default visuals.
Users say that the report is slow to load the visuals when they access and interact with the report.
You need to recommend a solution to improve the performance of the report.
What should you recommend?
A. Change any DAX measures to use iterator functions.
B. Implement row-level security (RLS).
C. Replace the default visuals with AppSource visuals.
D. Split the visuals onto multiple pages.
You have the visual shown in the exhibit. (Click the Exhibit tab.)You need to show the relationship between Total Cost and Total Sales over time. What should you do?
A. Add a play axis.
B. From the Analytics pane, add an Average line.
C. Add a slicer for the year.
D. Create a DAX measure that calculates year-over-year growth.
You are creating a report in Power BI Desktop.
You load a data extract that includes a free text field named coll.
You need to analyze the frequency distribution of the string lengths in col1. The solution must not affect the size of the model.
What should you do?
A. In the report, add a DAX calculated column that calculates the length of col1
B. In the report, add a DAX function that calculates the average length of col1
C. From Power Query Editor, add a column that calculates the length of col1
D. From Power Query Editor, change the distribution for the Column profile to group by length for col1
Note: This question is part of a series of questions that present the same scenario. Each question in the series contains a unique solution that might meet the stated goals. Some question sets might have more than one correct solution, while others might not have a correct solution.
After you answer a question in this section, you will NOT be able to return to it. As a result, these questions will not appear in the review screen.
You are modeling data by using Microsoft Power BI. Part of the data model is a large Microsoft SQL Server table named Order that has more than 100 million records.
During the development process, you need to import a sample of the data from the Order table.
Solution: From Power Query Editor, you import the table and then add a filter step to the query.
Does this meet the goal?
A. Yes
B. No
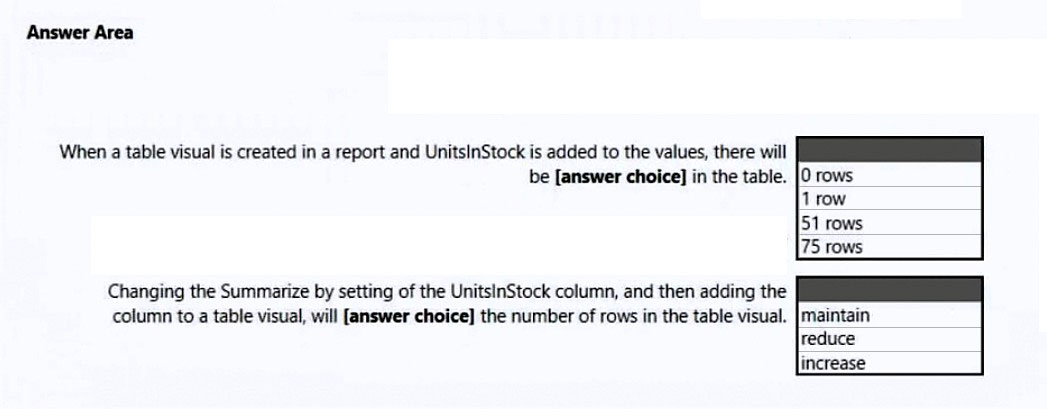
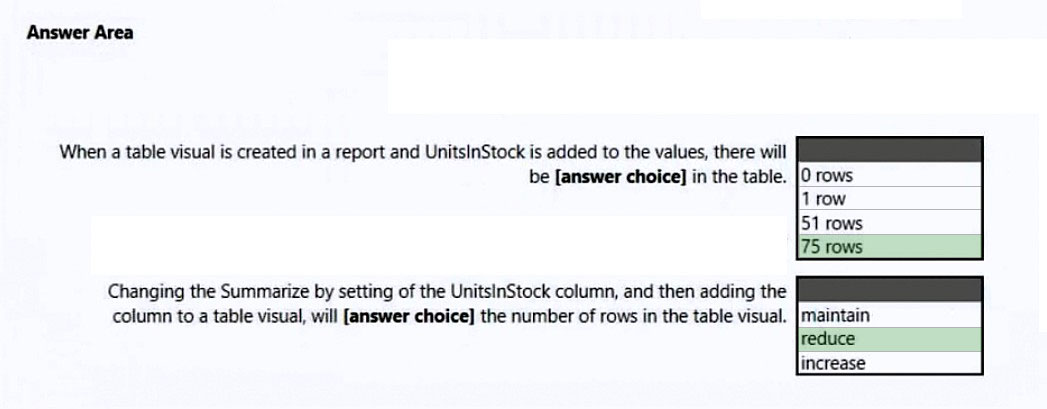
HOTSPOT - You have a column named UnitsInStock as shown in the following exhibit.UnitsInStock has 75 non-null values, of which 51 are unique. Use the drop-down menus to select the answer choice that completes each statement based on the information presented in the graphic. NOTE: Each correct selection is worth one point. Hot Area:
HOTSPOT - You have the Azure SQL databases shown in the following table.You plan to build a single PBIX file to meet the following requirements: • Data must be consumed from the database that corresponds to each stage of the development lifecycle. • Power BI deployment pipelines must NOT be used. • The solution must minimize administrative effort. What should you do? To answer, select the appropriate options in the answer area. NOTE: Each correct selection is worth one point.


You have a Power BI report. The report contains a visual that shows gross sales by date. The visual has anomaly detection enabled.
No anomalies are detected.
You need to increase the likelihood that anomaly detection will identify anomalies in the report.
What should you do?
A. Increase the Expected range transparency setting.
B. Add a data field to the Legend field well.
C. Increase the Sensitivity setting.
D. Add a data field to the Secondary values field well.
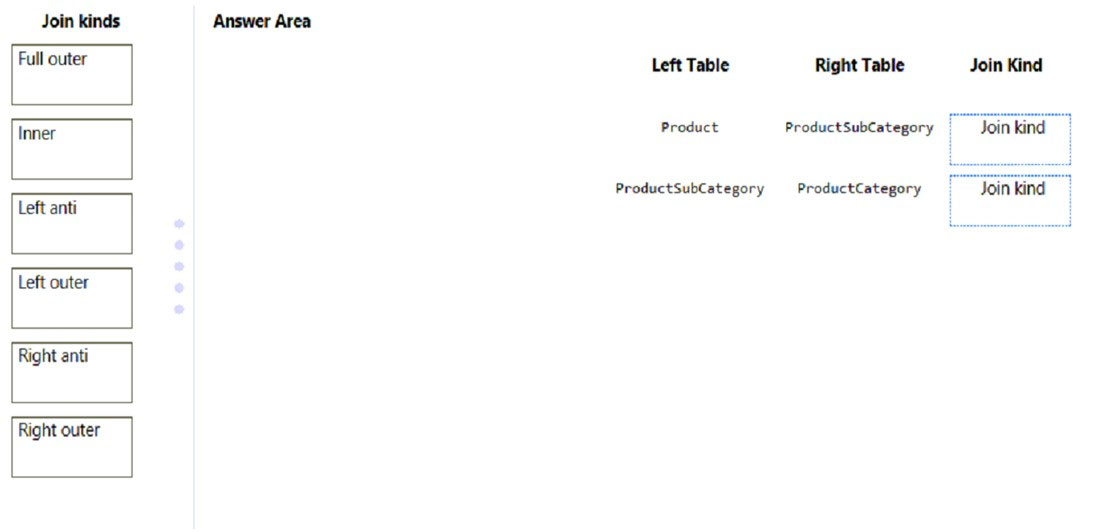
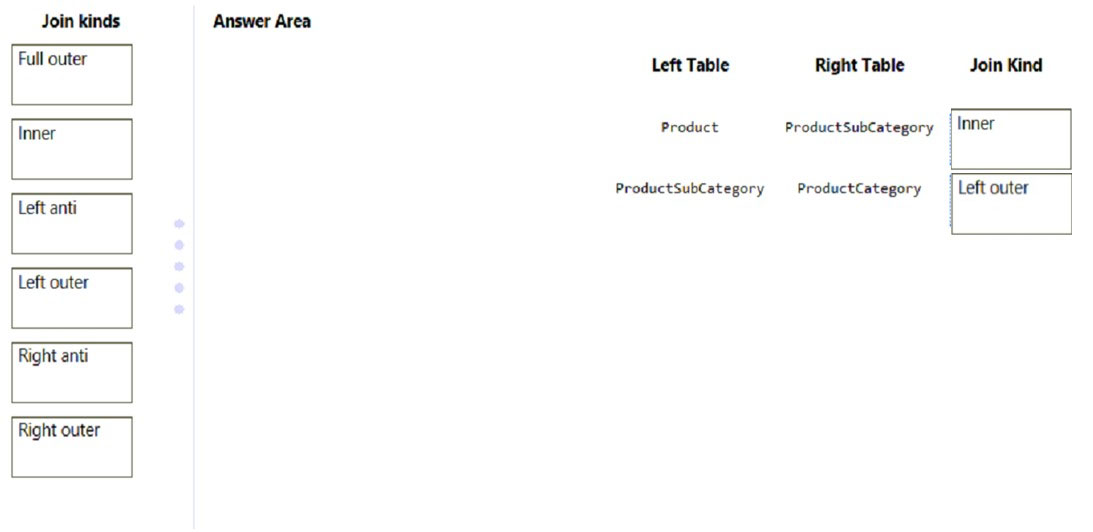
DRAG DROP -
In Power Query Editor, you have three queries named ProductCategory, ProductSubCategory, and Product.
Every Product has a ProductSubCategory.
Not every ProductsubCategory has a parent ProductCategory.
You need to merge the three queries into a single query. The solution must ensure the best performance in Power Query.
How should you merge the tables? To answer, drag the appropriate merge types to the correct queries. Each merge type may be used once, more than once, or not at all. You may need to drag the split bar between panes or scroll to view content.
NOTE: Each correct selection is worth one point.
Select and Place:
HOTSPOT - You have the Power BI data model shown in the following exhibit.You need to create a measure to count the number of product categories that had products sold during a selected period. How should you complete the DAX expression? To answer, select the appropriate options in the answer area. NOTE: Each correct selection is worth one point.


You have a Power BI data model that contains two tables named Sales and Date. The Sales table contains three measures named Order Quantity, Product Cost, and Sales Amount. You need to create the visual shown in the following exhibit.In which section of the Fields well should you place the measures?
A. Columns
B. Rows
C. Values
D. Drill through
You attempt to connect Power BI Desktop to a Cassandra database.
From the Get Data connector list, you discover that there is no specific connector for the Cassandra database.
You need to select an alternate data connector that will connect to the database.
Which type of connector should you choose?
A. Microsoft SQL Server database
B. ODBC
C. OLE DB
D. OData
You have a Power BI data model that analyzes product sales over time. The data model contains the following tables.A one-to-many relationship exists between the tables. The auto date/time option for the data model is enabled. You need to reduce the size of the data model while maintaining the ability to analyze product sales by month and quarter. Which two actions should you perform? Each correct answer presents part of the solution. NOTE: Each correct answer is worth one point.
A. Create a relationship between the Date table and the Sales table.
B. Disable the auto date/time option.
C. Create a Date table and select Mark as Date Table.
D. Disable the load on the Date table.
E. Remove the relationship between the Product table and the Sales table.
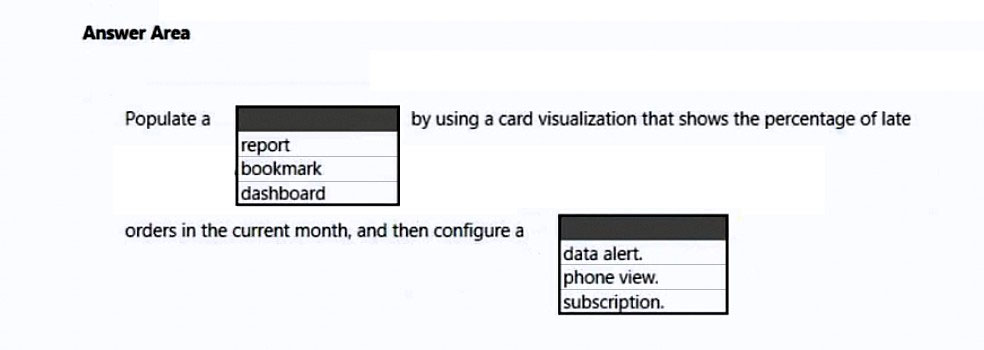
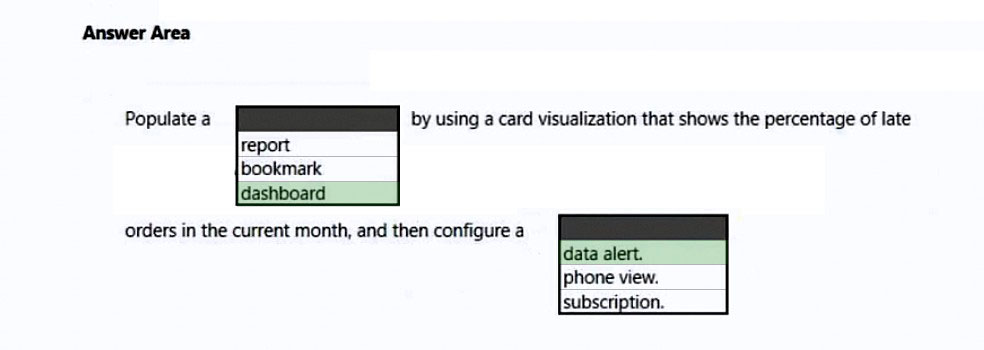
HOTSPOT -
You need to create a solution to meet the notification requirements of the warehouse shipping department.
What should you do? To answer, select the appropriate options in the answer area.
NOTE: Each correct selection is worth one point.
Hot Area:
A business intelligence (BI) developer creates a dataflow in Power BI that uses DirectQuery to access tables from an on-premises Microsoft SQL server. The
Enhanced Dataflows Compute Engine is turned on for the dataflow.
You need to use the dataflow in a report. The solution must meet the following requirements:
✑ Minimize online processing operations.
✑ Minimize calculation times and render times for visuals.
✑ Include data from the current year, up to and including the previous day.
What should you do?
A. Create a dataflows connection that has DirectQuery mode selected.
B. Create a dataflows connection that has DirectQuery mode selected and configure a gateway connection for the dataset.
C. Create a dataflows connection that has Import mode selected and schedule a daily refresh.
D. Create a dataflows connection that has Import mode selected and create a Microsoft Power Automate solution to refresh the data hourly.
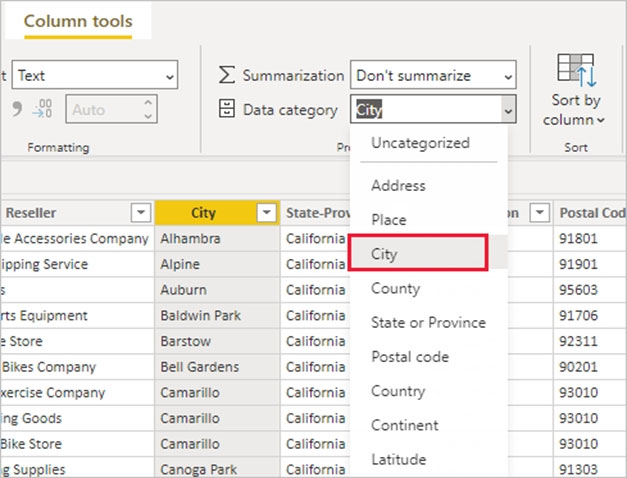
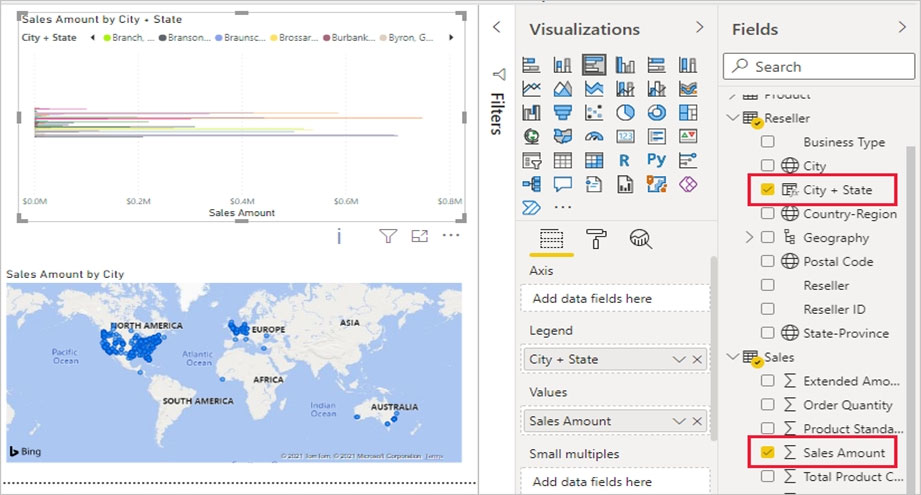
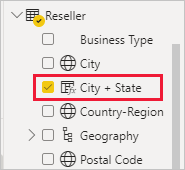
You are building a Power BI report.
Users will view the report by using their mobile device.
You need to configure the report to display data based on each user's location.
Which two actions should you perform? Each correct answer presents part of the solution.
NOTE: Each correct selection is worth one point.
A. From Power Query Editor, detect the data types of the relevant columns.
B. In Data Category, set the geographic data category for the relevant columns.
C. Create a hierarchy for columns of the geography data type.
D. Use the columns of the geography data type in all visuals.
E. For the relevant columns, set synonyms to match common geographical terms.
You use Power Query Editor to import and preview sales data from the years 2020 and 2021 in a Microsoft Excel file as shown in the following exhibit.You need to shape the query to display the following three columns: • Month • Sales • Year What should you select in Power Query Editor?
A. Merge columns
B. Transpose
C. Unpivot columns
D. Pivot column
HOTSPOT
-
You are creating a Power BI model to analyze inventory.
You load data into three tables named Date, Product, and Inventory. The Inventory table relates to the Date and Product tables by using one-to-many relationships.
Inventory data is recorded daily with no exceptions. The correct inventory quantity for a given product in a month is the last recorded value for that month.
You need to write a DAX measure that will show the correct inventory value when a user analyzes inventory by year, month, or date.
How should you complete the measure? To answer, select the appropriate options in the answer area.
NOTE: Each correct selection is worth one point.


You have a dataset that is used infrequently and refreshes every hour.
You receive a notification that the refresh was disabled due to inactivity.
Which two actions will cause the scheduled refresh schedule to resume? Each correct answer presents a complete solution.
NOTE: Each correct selection is worth one point.
A. Enable query caching for the dataset.
B. Import the dataset to Microsoft Excel.
C. From the Power BI service, open a dashboard that uses the dataset.
D. From the Power BI service, open a report that uses the dataset.
E. From PowerShell, run the get-powerbireport cmdlet.
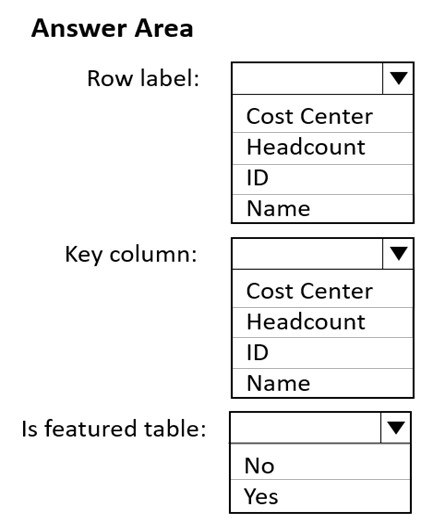
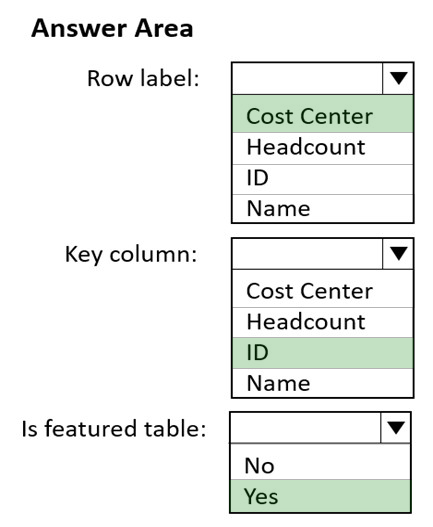
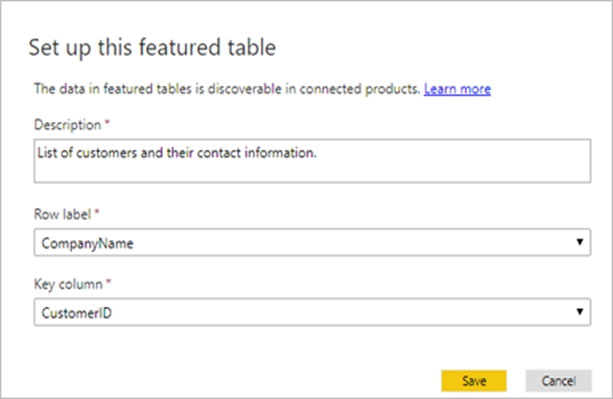
HOTSPOT - You create a Power BI dataset that contains the table shown in the following exhibit.You need to make the table available as an organizational data type in Microsoft Excel. How should you configure the properties of the table? To answer, select the appropriate options in the answer area. NOTE: Each correct selection is worth one point. Hot Area:
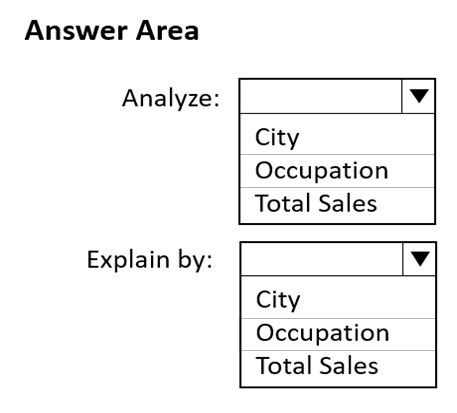
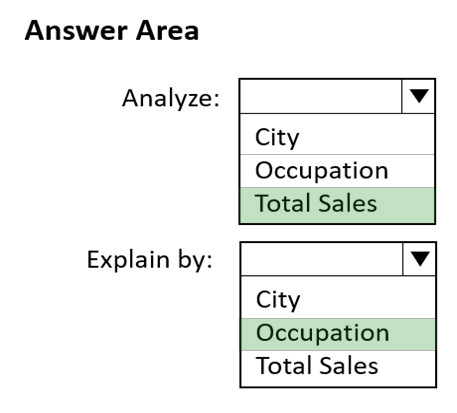
HOTSPOT - You have a table that contains the following three columns: City -✑ Total Sales ✑ Occupation You need to create a key influencers visualization as shown in the exhibit. (Click the Exhibit tab.)
How should you configure the visualization? To answer, select the appropriate options in the answer area. NOTE: Each correct selection is worth one point. Hot Area:
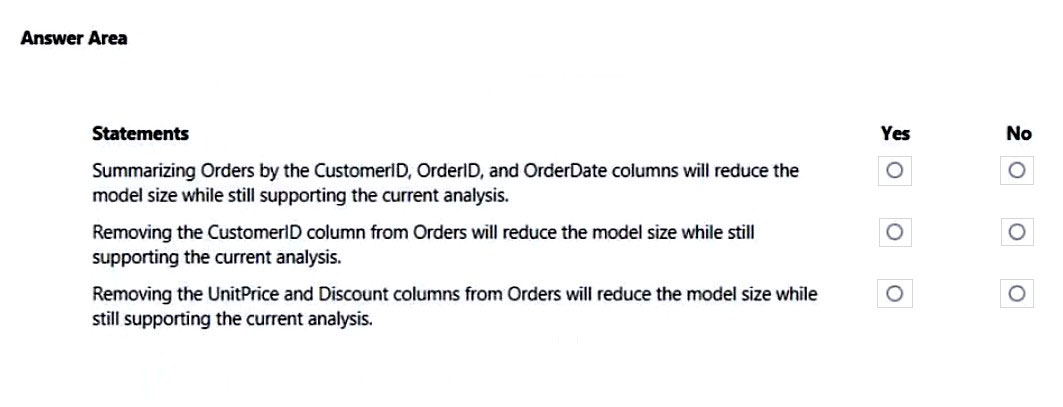
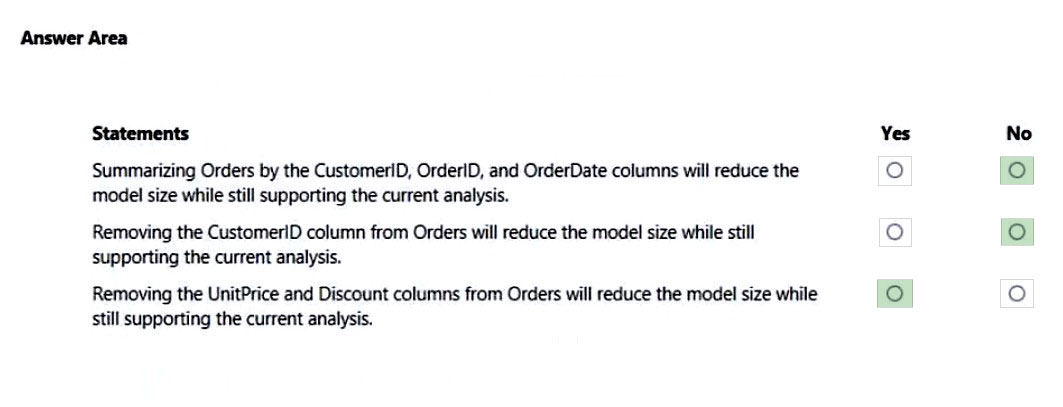
HOTSPOT - You have a Power BI report named Orders that supports the following analysis: ✑ Total sales over time ✑ The count of orders over time ✑ New and repeat customer counts The data model size is nearing the limit for a dataset in shared capacity. The model view for the dataset is shown in the following exhibit.The data view for the Orders table is shown in the following exhibit.
The Orders table relates to the Customers table by using the CustomerID column. The Orders table relates to the Date table by using the OrderDate column. For each of the following statements, select Yes if the statement is true, Otherwise, select No. NOTE: Each correct selection is worth one point. Hot Area:
You attempt to connect Power BI Desktop to a Cassandra database.
From the Get Data connector list, you discover that there is no specific connector for the Cassandra database.
You need to select an alternate data connector that will connect to the database.
Which type of connector should you choose?
A. Microsoft SQL Server database
B. ODBC
C. OLE DB
D. OData
You have a dataset that is used infrequently and refreshes every hour.
You receive a notification that the refresh was disabled due to inactivity.
Which two actions will cause the scheduled refresh schedule to resume? Each correct answer presents a complete solution.
NOTE: Each correct selection is worth one point.
A. Enable query caching for the dataset.
B. Import the dataset to Microsoft Excel.
C. From the Power BI service, open a dashboard that uses the dataset.
D. From the Power BI service, open a report that uses the dataset.
E. From PowerShell, run the get-powerbireport cmdlet.
You have a CSV file that contains user complaints. The file contains a column named Logged. Logged contains the date and time each complaint occurred. The data in Logged is in the following format: 2018-12-31 at 08:59.
You need to be able to analyze the complaints by the logged date and use a built-in date hierarchy.
What should you do?
A. Apply a transformation to extract the last 11 characters of the Logged column and set the data type of the new column to Date.
B. Change the data type of the Logged column to Date.
C. Split the Logged column by using at as the delimiter.
D. Apply the Parse function from the Date transformations options to the Logged column.
You have a Power BI model that contains a table named Date. The Date table contains the following columns:
•	Date
•	Fiscal Year
•	Fiscal Quarter
•	Month Name
•	Calendar Year
•	Week Number
•	Month Number
•	Calendar Quarter
You need to create a calculated table based on the Date table. The calculated table must contain only unique combinations of values for Calendar Year, Calendar Quarter, and Calendar Month.
Which DAX function should you include in the table definition?
A. ADDCOLUMNS
B. CALCULATE
C. SUMMARIZE
D. DATATABLE
HOTSPOT - You create a Power BI dataset that contains the table shown in the following exhibit.
You have a Microsoft Power BI report. The size of PBIX file is 550 MB. The report is accessed by using an App workspace in shared capacity of powerbi.com.
The report uses an imported dataset that contains one fact table. The fact table contains 12 million rows. The dataset is scheduled to refresh twice a day at 08:00 and 17:00.
The report is a single page that contains 15 AppSource visuals and 10 default visuals.
Users say that the report is slow to load the visuals when they access and interact with the report.
You need to recommend a solution to improve the performance of the report.
What should you recommend?
A. Enable visual interactions.
B. Change any DAX measures to use iterator functions.
C. Implement row-level security (RLS).
D. Remove unused columns from tables in the data model.
After you answer a question in this section, you will NOT be able to return to it. As a result, these questions will not appear in the review screen. From Power Query Editor, you profile the data shown in the following exhibit.The IoT GUID and IoT ID columns are unique to each row in the query. You need to analyze IoT events by the hour and day of the year. The solution must improve dataset performance. Solution: You change the IoT DateTime column to the Date data type. Does this meet the goal?
A. Yes
B. No
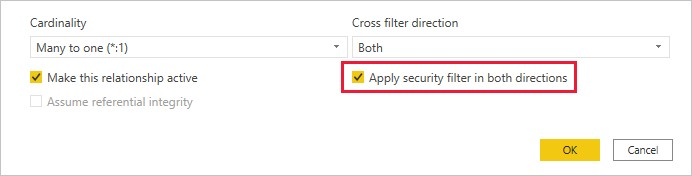
In Power BI Desktop, you are building a sales report that contains two tables. Both tables have row-level security (RLS) configured.
You need to create a relationship between the tables. The solution must ensure that bidirectional cross-filtering honors the RLS settings.
What should you do?
A. Create an inactive relationship between the tables and select Apply security filter in both directions.
B. Create an active relationship between the tables and select Apply security filter in both directions.
C. Create an inactive relationship between the tables and select Assume referential integrity.
D. Create an active relationship between the tables and select Assume referential integrity.
Free Access Full PL-300 Practice Questions Free
Want more hands-on practice? Click here to access the full bank of PL-300 practice questions free and reinforce your understanding of all exam objectives.
We update our question sets regularly, so check back often for new and relevant content.
Good luck with your PL-300 certification journey!