

PL-300 Mock Test Free – 50 Realistic Questions to Prepare with Confidence.
Getting ready for your PL-300 certification exam? Start your preparation the smart way with our PL-300 Mock Test Free – a carefully crafted set of 50 realistic, exam-style questions to help you practice effectively and boost your confidence.
Using a mock test free for PL-300 exam is one of the best ways to:
- Familiarize yourself with the actual exam format and question style
- Identify areas where you need more review
- Strengthen your time management and test-taking strategy
Below, you will find 50 free questions from our PL-300 Mock Test Free resource. These questions are structured to reflect the real exam’s difficulty and content areas, helping you assess your readiness accurately.
You are using the key influencers visual to identify which factors affect the quantity of items sold in an order. You add the following fields to the Explain By field: ✑ Customer Country ✑ Product Category ✑ Supplier Country ✑ Sales Employee ✑ Supplier Name ✑ Product Name ✑ Customer City The key influencers visual returns the results shown in the following exhibit.What can you identify from the visual?
A. Customers in Austria order 18.8 more units than the average order quantity.
B. Customers in Boise order 20.37 percent more than the average order quantity.
C. Product Category positively influences the quantity per order.
D. Customers in Cork order lower quantities than average.
You have a Power BI workspace that contains a dataset, a report, and a dashboard. The following groups have access:
✑ External users can access the dashboard.
✑ Managers can access the dashboard and a manager-specific report.
✑ Employees can access the dashboard and a row-level security (RLS) constrained report.
You need all users, including the external users, to be able to tag workspace administrators if they identify an issue with the dashboard. The solution must ensure that other users see the issues that were raised.
What should you use?
A. comments
B. chat in Microsoft Teams
C. alerts
D. subscriptions
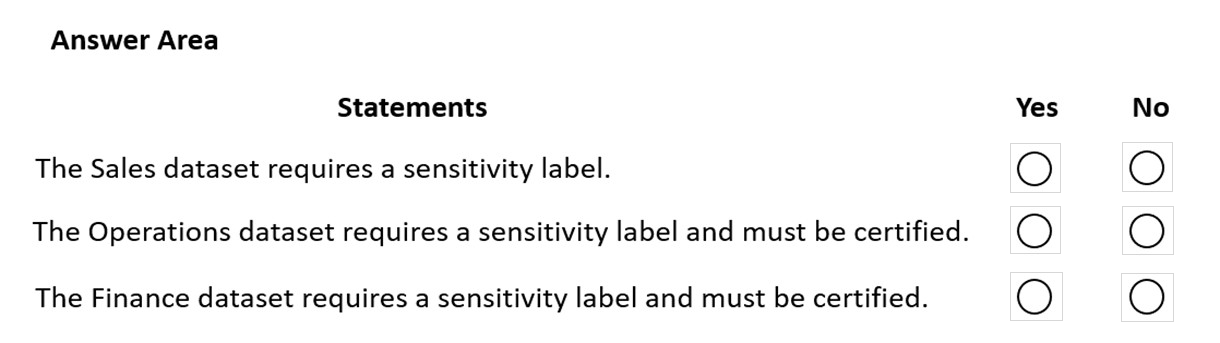
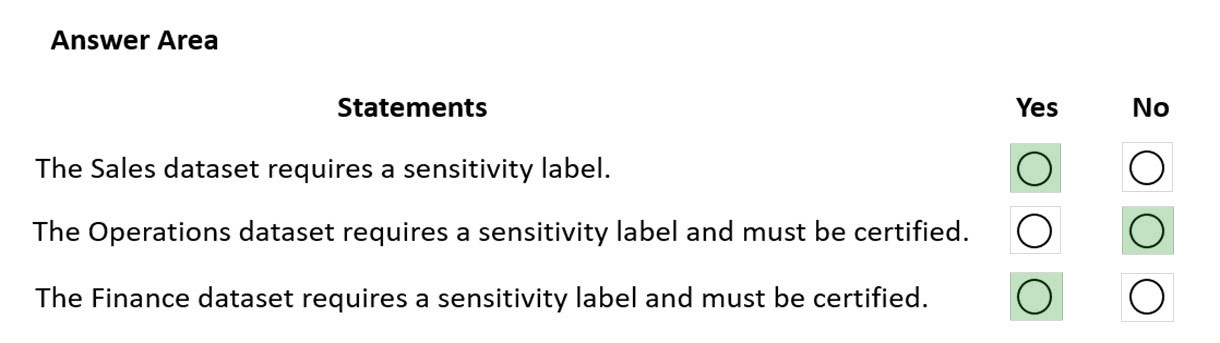
HOTSPOT - You have a Power BI tenant that hosts the datasets shown in the following table.You have the following requirements: The export of reports that contain Personally Identifiable Information (PII) must be prevented. Data used for financial decisions must be reviewed and approved before use. For each of the following statements, select Yes if the statement is true. Otherwise, select No. NOTE: Each correct selection is worth one point. Hot Area:
You have the Power BI data model shown in the following exhibit.The Sales table contains records of sales by day from the last five years up until today’s date. You plan to create a measure to return the total sales of March 2021 when March 2022 is selected. Which DAX expression should you use?
A. Calculate (Sum(Sales[Sales]), PREVIOUSYEAR( dimDate[Date])
B. TOTALYTD (SUM(Sales[Sales]), dimDate[Date] )
C. Calculate (SUM(Sales[Sales]), SAMEPERIODLASTYEAR(dimDate[Date] ))
D. SUM(Sales[Sales])
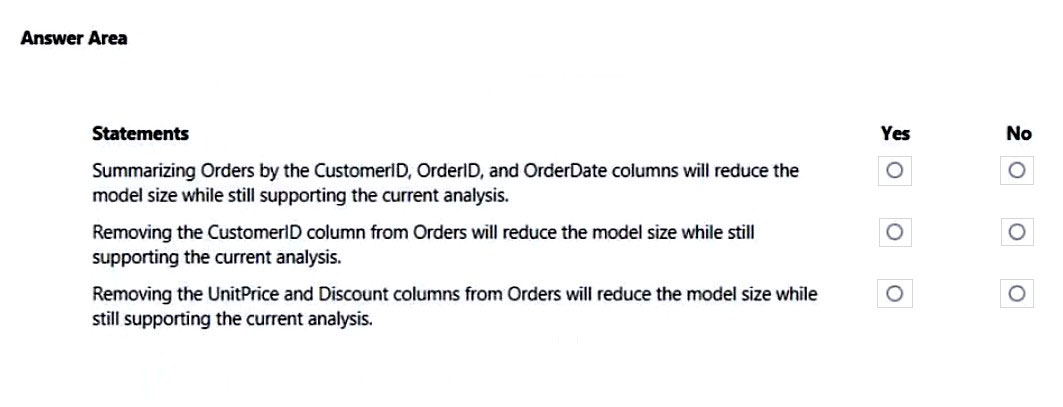
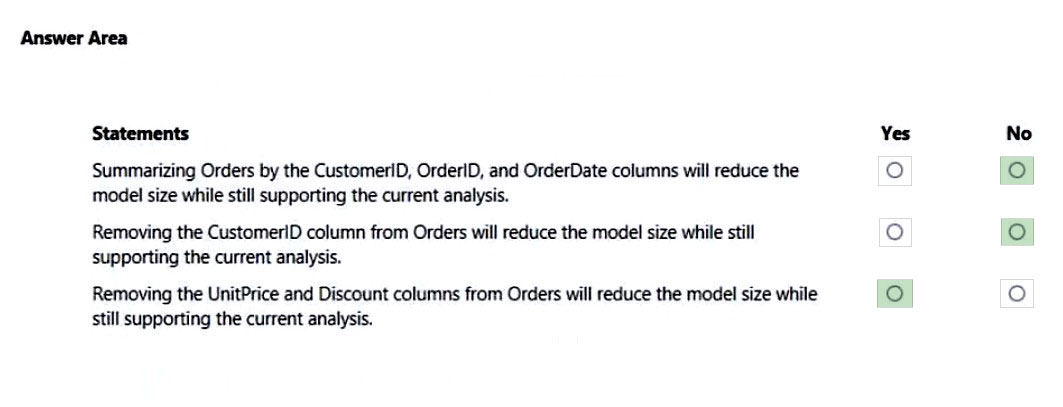
HOTSPOT - You have a Power BI report named Orders that supports the following analysis: ✑ Total sales over time ✑ The count of orders over time ✑ New and repeat customer counts The data model size is nearing the limit for a dataset in shared capacity. The model view for the dataset is shown in the following exhibit.The data view for the Orders table is shown in the following exhibit.
The Orders table relates to the Customers table by using the CustomerID column. The Orders table relates to the Date table by using the OrderDate column. For each of the following statements, select Yes if the statement is true, Otherwise, select No. NOTE: Each correct selection is worth one point. Hot Area:
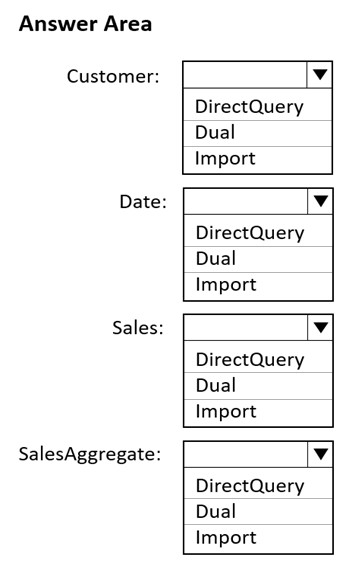
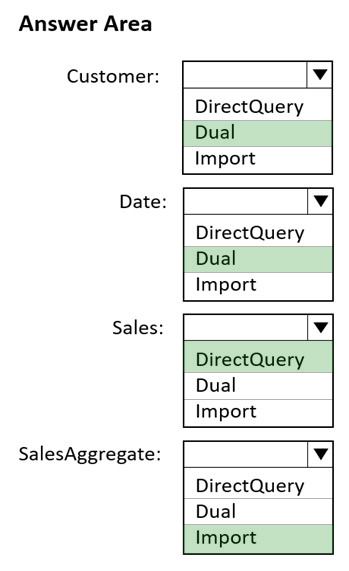
HOTSPOT - You plan to create the Power BI model shown in the exhibit. (Click the Exhibit tab.)The data has the following refresh requirements: ✑ Customer must be refreshed daily. ✑ Date must be refreshed once every three years. ✑ Sales must be refreshed in near real time. ✑ SalesAggregate must be refreshed once per week. You need to select the storage modes for the tables. The solution must meet the following requirements: ✑ Minimize the load times of visuals. ✑ Ensure that the data is loaded to the model based on the refresh requirements. Which storage mode should you select for each table? To answer, select the appropriate options in the answer area. NOTE: Each correct selection is worth one point. Hot Area:
You have a Power BI tenant.
You have reports that use financial datasets and are exported as PDF files.
You need to ensure that the reports are encrypted.
What should you implement?
A. Microsoft Intune policies
B. row-level security (RLS)
C. sensitivity labels
D. dataset certifications
You have a Power BI report that contains three pages named Page1, Page2, and Page3. All the pages have the same slicers.
You need to ensure that all the filters applied to Page1 apply to Page1 and Page3 only.
What should you do?
A. On each page, modify the interactions of the slicer.
B. Enable visibility of the slicers on Page1 and Page3. Disable visibility of the slicer on Page2.
C. Sync the slicers on Page1 and Page3.
You are building a Power BI report to analyze customer segments.
You need to identify customer segments dynamically based on the Bounce Rate across dimensions such as source, geography, and demographics. The solution must minimize analysis effort.
Which type of visualization should you use?
A. decomposition tree
B. funnel chart
C. Q&A
D. key influencers
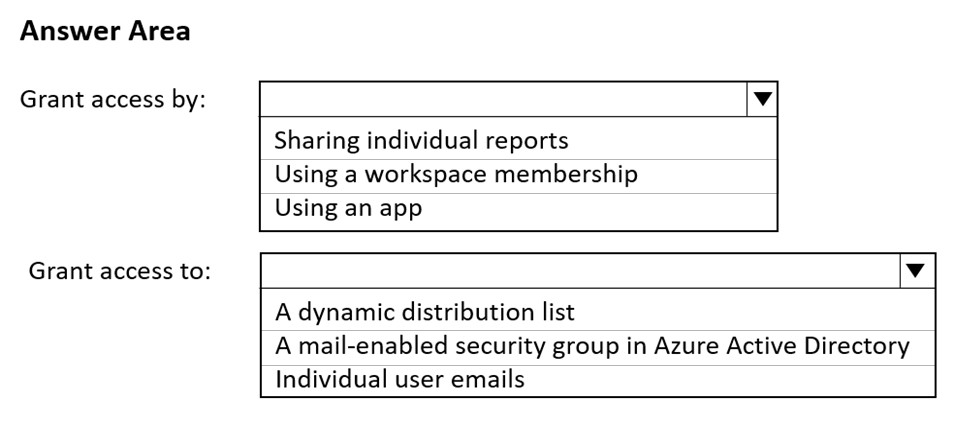
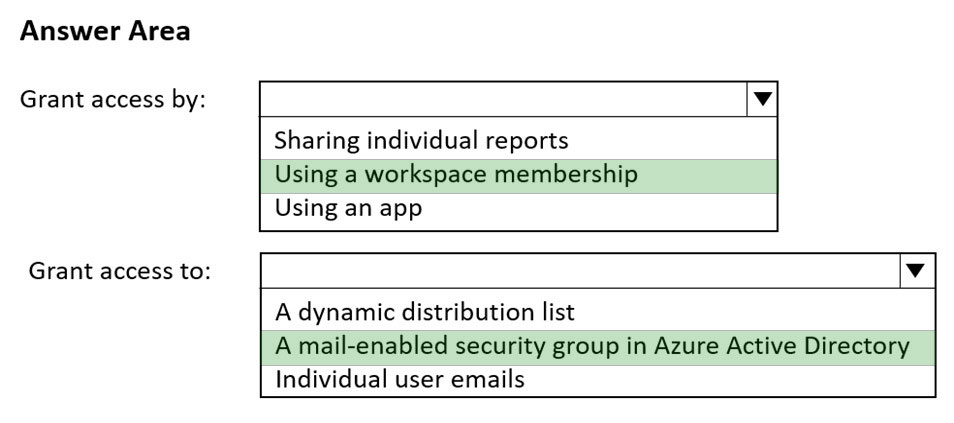
HOTSPOT -
How should you distribute the reports to the board? To answer, select the appropriate options in the answer area.
NOTE: Each correct selection is worth one point.
Hot Area:
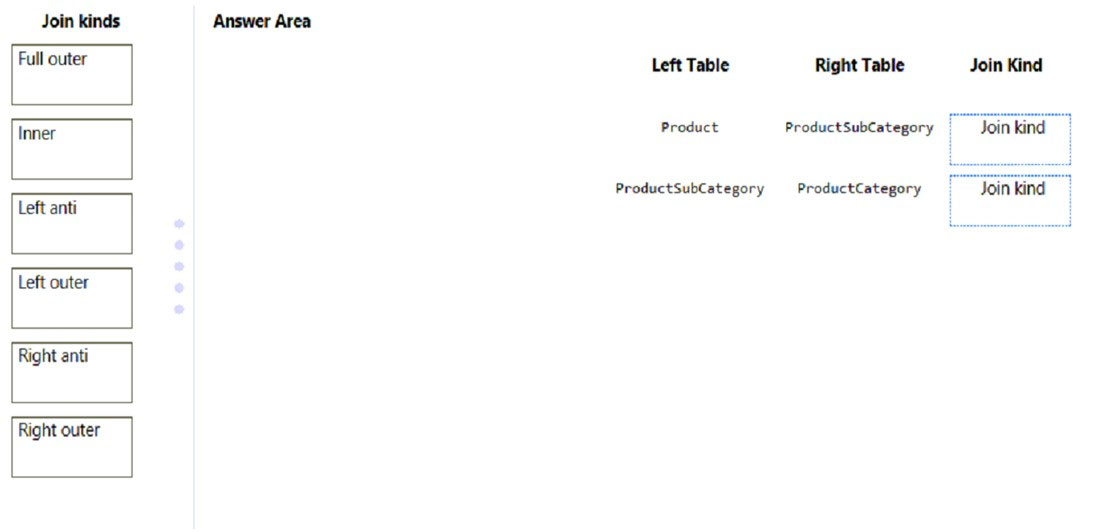
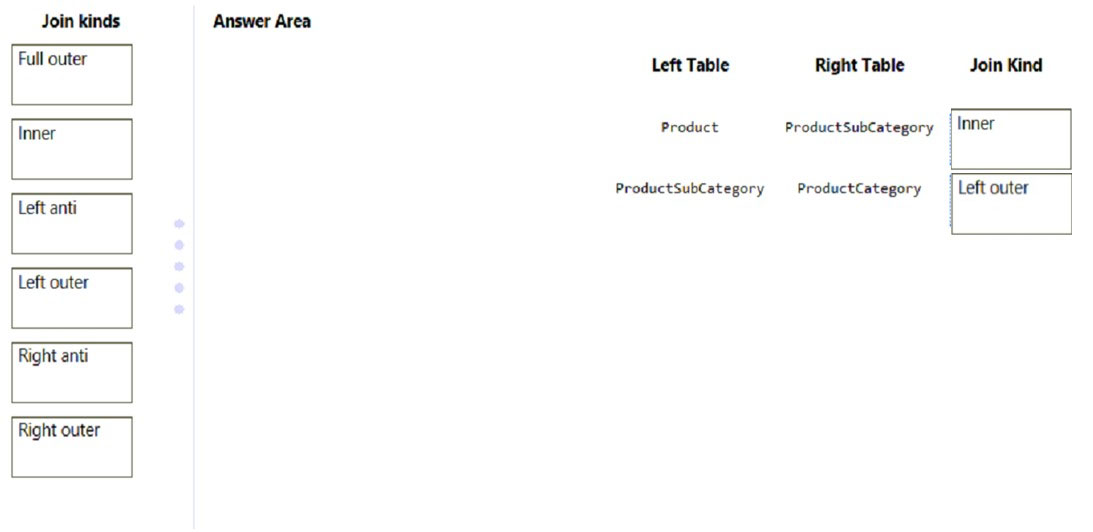
DRAG DROP -
In Power Query Editor, you have three queries named ProductCategory, ProductSubCategory, and Product.
Every Product has a ProductSubCategory.
Not every ProductsubCategory has a parent ProductCategory.
You need to merge the three queries into a single query. The solution must ensure the best performance in Power Query.
How should you merge the tables? To answer, drag the appropriate merge types to the correct queries. Each merge type may be used once, more than once, or not at all. You may need to drag the split bar between panes or scroll to view content.
NOTE: Each correct selection is worth one point.
Select and Place:
After you answer a question in this section, you will NOT be able to return to it. As a result, these questions will not appear in the review screen.
You are modeling data by using Microsoft Power BI. Part of the data model is a large Microsoft SQL Server table named Order that has more than 100 million records.
During the development process, you need to import a sample of the data from the Order table.
Solution: You write a DAX expression that uses the FILTER function.
Does this meet the goal?
A. Yes
B. No
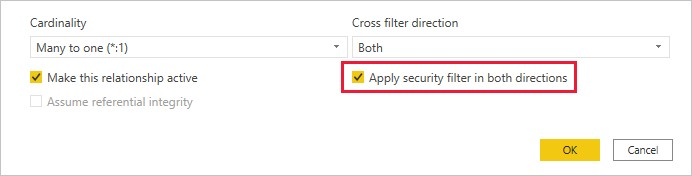
In Power BI Desktop, you are building a sales report that contains two tables. Both tables have row-level security (RLS) configured.
You need to create a relationship between the tables. The solution must ensure that bidirectional cross-filtering honors the RLS settings.
What should you do?
A. Create an inactive relationship between the tables and select Apply security filter in both directions.
B. Create an active relationship between the tables and select Apply security filter in both directions.
C. Create an inactive relationship between the tables and select Assume referential integrity.
D. Create an active relationship between the tables and select Assume referential integrity.
HOTSPOT -
You are building a financial report by using Power BI.
You have a table named financials that contains a column named Date and a column named Sales.
You need to create a measure that calculates the relative change in sales as compared to the previous quarter.
How should you complete the measure? To answer, select the appropriate options in the answer area.
NOTE: Each correct selection is worth one point.
Hot Area:


You have a Power BI dashboard that monitors the quality of manufacturing processes. The dashboard contains the following elements:
✑ A line chart that shows the number of defective products manufactured by day
✑ A KPI visual that shows the current daily percentage of defective products manufactured
You need to be notified when the daily percentage of defective products manufactured exceeds 3%.
What should you create?
A. a subscription
B. an alert
C. a smart narrative visual
D. a Q&A visual
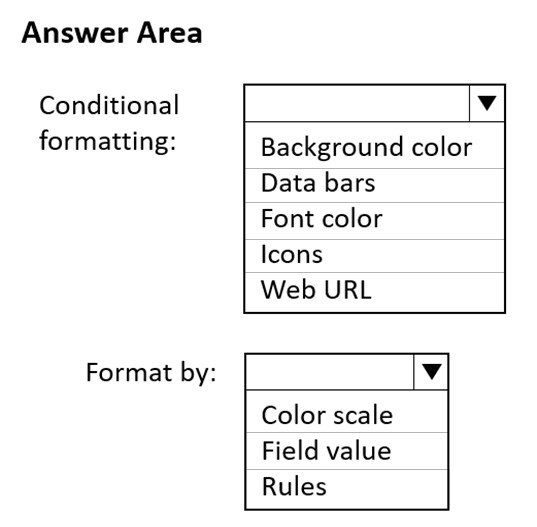
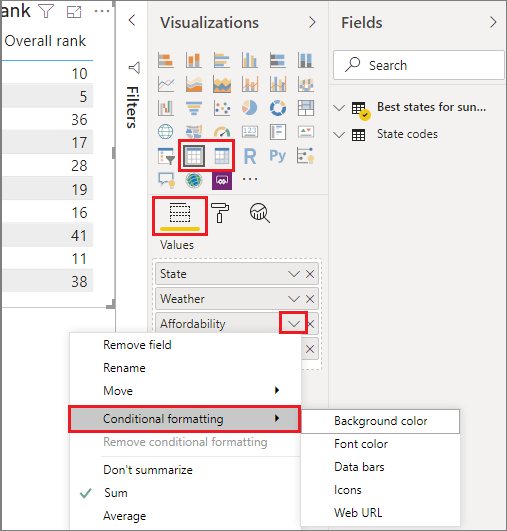
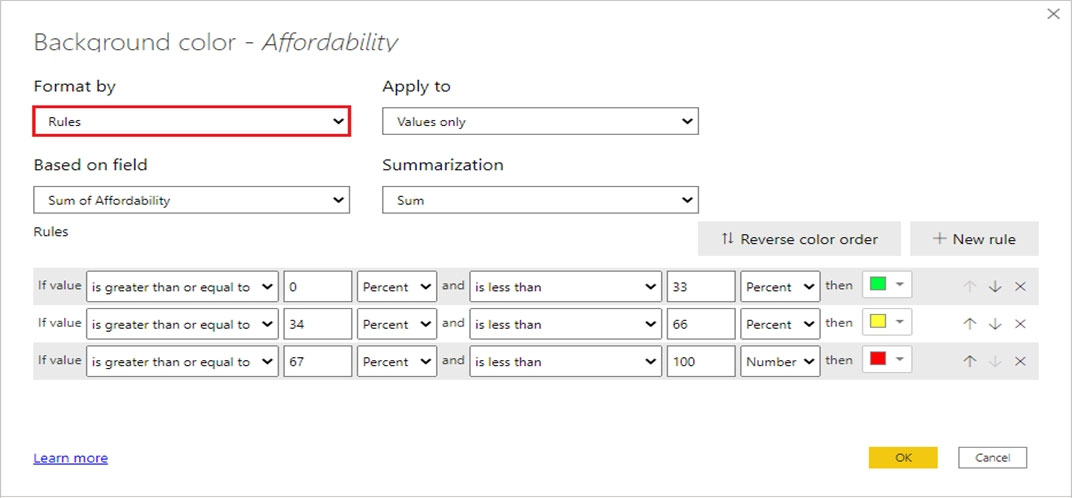
HOTSPOT - You need to create a visual as shown in the following exhibit.The indicator color for Total Sales will be based on % Growth to Last Year. The solution must use the existing calculations only. How should you configure the visual? To answer, select the appropriate options in the answer area. NOTE: Each correct selection is worth one point. Hot Area:

After you answer a question in this section, you will NOT be able to return to it. As a result, these questions will not appear in the review screen.
You have a clustered bar chart that contains a measure named Salary as the value and a field named Employee as the axis. Salary is present in the data as a numerical amount representing US dollars.
You need to create a reference line to show which employees are above the median salary.
Solution: You create an average line by using the Salary measure.
Does this meet the goal?
A. Yes
B. No
Overview - Litware, Inc. is an online retailer that uses Power BI. Litware plans to leverage data from an Azure SQL database that stores data for the company's live e-commerce website. Litware uses Azure Active Directory (Azure AD) to authenticate users. Existing Environment. Sales Data Litware has online sales data that has the SQL schema shown in the following table.In the Date table, the date_id column has a format of yyyymmdd and the month column has a format of yyyymm. The week column in the Date table and the week_id column in the Weekly_Returns table have a format of yyyyww. In the Sales table, the sales_id column represents a unique transaction. The region id column can be managed by only one sales manager. Existing Environment. Data Concerns You are concerned with the quality and completeness of the sales data. You must ensure that negative and missing sales_amount values do NOT contribute to the total sales amount calculation. Existing Environment. Reporting Requirements Litware identifies the following reporting requirements: Executives require a visual that shows sales by region. Executives require a visual that shows returns by region manager and the sales managers that report to them. The sales managers must be able to see only the sales data of their respective region. The sales managers require a visual to analyze sales performance versus sales targets. The sales department requires reports that contain the number of sales transactions. Users must be able to see the month in each report as shown in the following example: Feb 2020. The customer service department requires a visual that can be filtered by both sales month and ship month independently. The maximum allowed latency to include transactions in reports is five minutes. You need to create a calculated column to display the month based on the reporting requirements. Which DAX expression should you use?
A. FORMAT(‘Date'[date],”MMM YYYY”)
B. FORMAT(‘Date'[date_id],”MMM”) & ” ” & FORMAT(‘Date'[year], “#”)
C. FORMAT(‘Date'[date_id],”MMM YYYY”)
D. FORMAT(‘Date'[date],”M YY”)
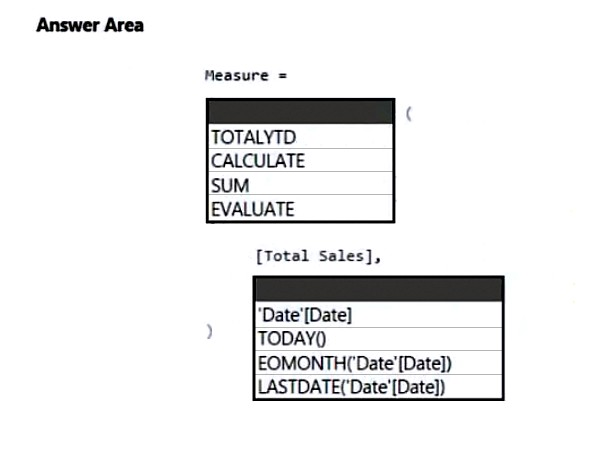
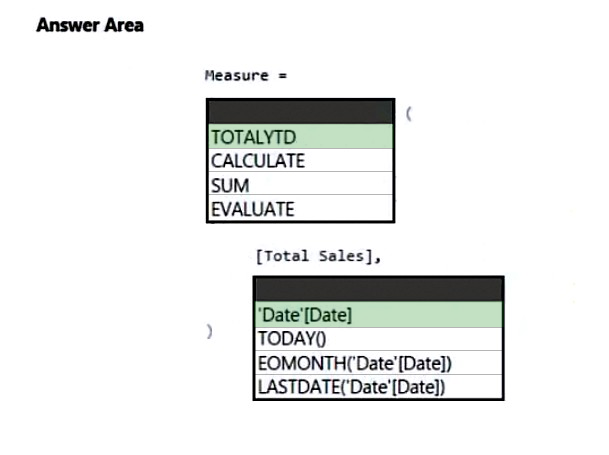
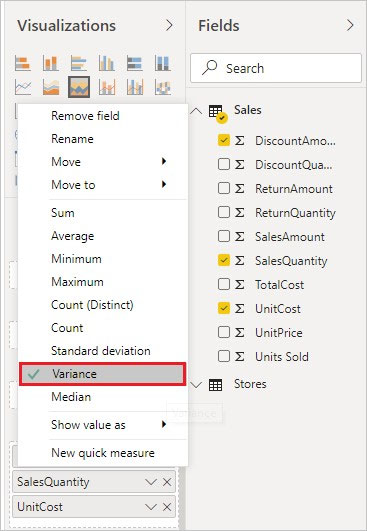
HOTSPOT -
You have a Power BI report that contains a measure named Total Sales.
You need to create a new measure that will return the sum of Total Sales for a year up to a selected date.
How should you complete the DAX expression? To answer, select the appropriate options in the answer area.
NOTE: Each correct selection is worth one point.
Hot Area:
You have a CSV file that contains user complaints. The file contains a column named Logged. Logged contains the date and time each complaint occurred. The data in Logged is in the following format: 2018-12-31 at 08:59.
You need to be able to analyze the complaints by the logged date and use a built-in date hierarchy.
What should you do?
A. Apply a transformation to extract the last 11 characters of the Logged column and set the data type of the new column to Date.
B. Change the data type of the Logged column to Date.
C. Split the Logged column by using at as the delimiter.
D. Apply a transformation to extract the first 11 characters of the Logged column.
You have a line chart that shows the number of employees in a department over time.
You need to see the total salary costs of the employees when you hover over a data point.
What should you do?
A. Add salary to the drillthrough fields.
B. Add salary to the visual filters.
C. Add salary to the tooltips.
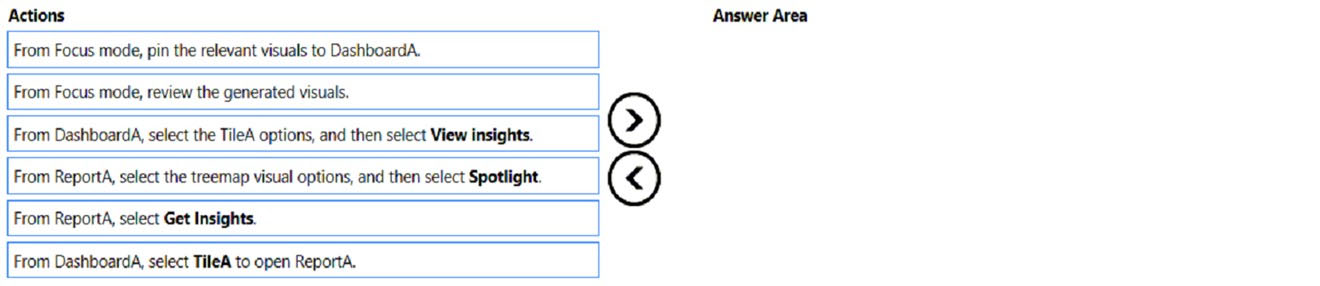
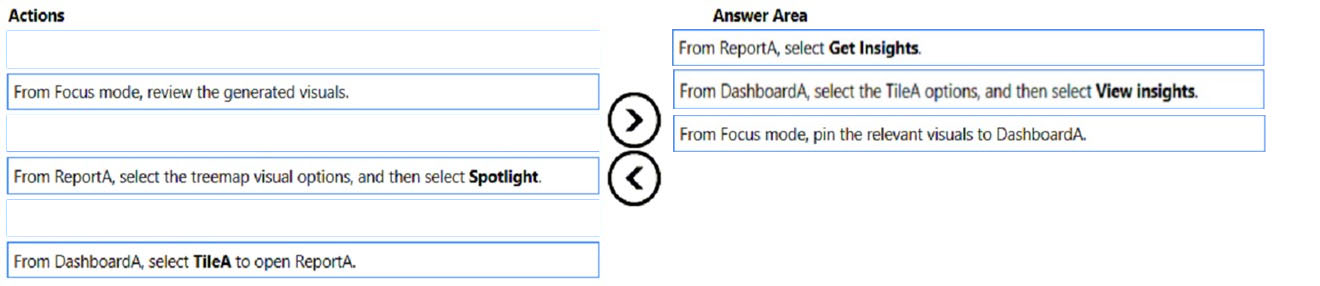
DRAG DROP -
You have a Power BI dashboard named DashboardA that contains a tile named TileA. TileA contains a treemap visual from a report named ReportA.
You need to provide the users of DashboardA with additional tiles that relate to the contents of TileA.
Which three actions should you perform in sequence? To answer, move the appropriate actions from the list of actions to the answer area and arrange them in the correct order.
Select and Place:
You have a Microsoft Power BI report. The size of PBIX file is 550 MB. The report is accessed by using an App workspace in shared capacity of powerbi.com.
The report uses an imported dataset that contains one fact table. The fact table contains 12 million rows. The dataset is scheduled to refresh twice a day at 08:00 and 17:00.
The report is a single page that contains 15 AppSource visuals and 10 default visuals.
Users say that the report is slow to load the visuals when they access and interact with the report.
You need to recommend a solution to improve the performance of the report.
What should you recommend?
A. Enable visual interactions.
B. Change any DAX measures to use iterator functions.
C. Implement row-level security (RLS).
D. Remove unused columns from tables in the data model.
You have more than 100 published datasets.
Ten of the datasets were verified to meet your corporate quality standards.
You need to ensure that the 10 verified datasets appear at the top of the list of published datasets whenever users search for existing datasets.
What should you do?
A. Promote the datasets.
B. Certify the datasets.
C. Feature the dataset on the home page.
D. Publish the datasets in an app.
You have a Power BI report that contains one page. The page contains two line charts and one bar chart.
You need to ensure that users can perform the following tasks for all three visuals:
•	Switch the measures used in the visuals.
•	Change the visualization type.
•	Add a legend.
The solution must minimize development effort.
What should you do?
A. Create a bookmark for each acceptable combination of visualization type, measure, and legend in the bar chart.
B. Edit the interactions between the three visuals.
C. Enable personalization for the report.
D. Enable personalization for each visual.
You have a Power BI workspace that contains several reports.
You need to provide a user with the ability to create a dashboard that will use the visuals from the reports.
What should you do?
A. Create a row-level security (RLS) role and add the user to the role.
B. Share the reports with the user.
C. Grant the Read permission for the datasets to the user.
D. Add the user as a member of the workspace.
E. Add the user as a Viewer of the workspace.
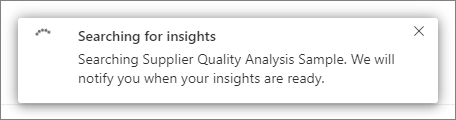
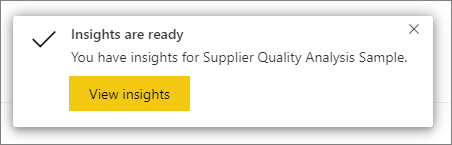
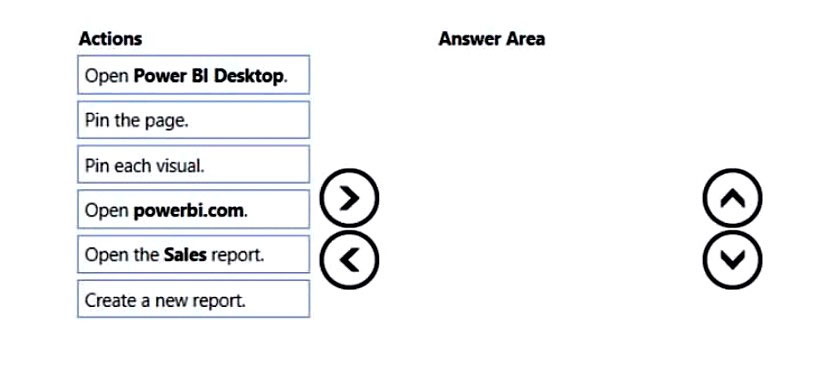
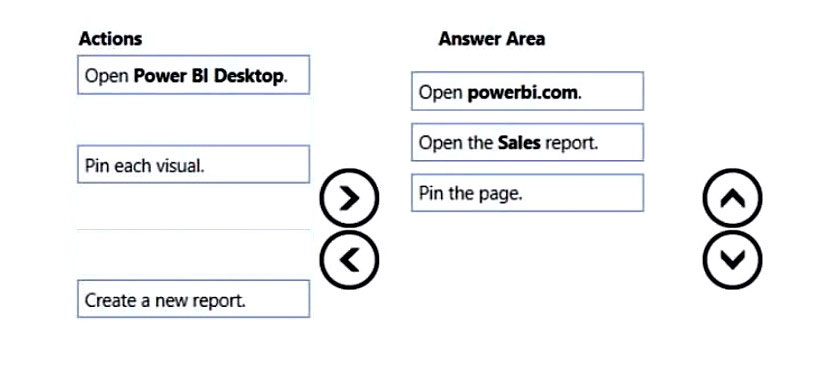
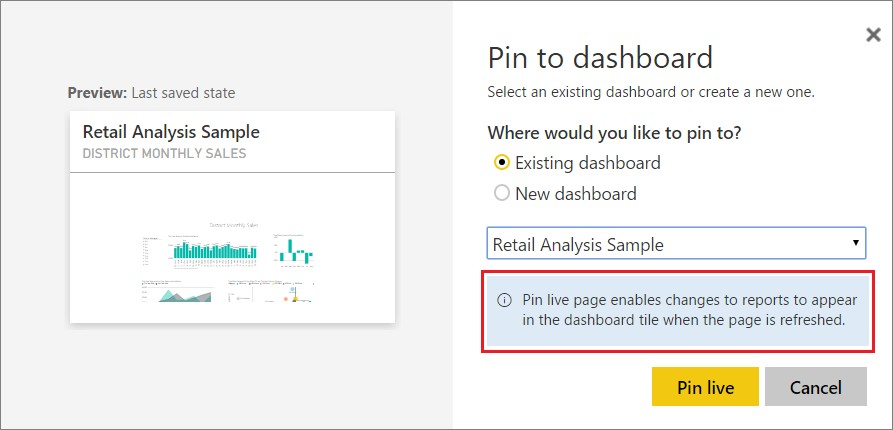
DRAG DROP -
You have a Power BI workspace that contains a single-page report named Sales.
You need to add all the visuals from Sales to a dashboard. The solution must ensure that additional visuals added to the page are added automatically to the dashboard.
Which three actions should you perform in sequence? To answer, move the appropriate actions from the list of actions to the answer area and arrange them in the correct order.
Select and Place:
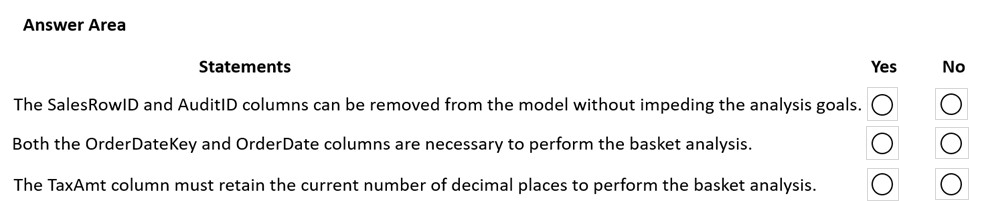
HOTSPOT - You are creating a Microsoft Power BI imported data model to perform basket analysis. The goal of the analysis is to identify which products are usually bought together in the same transaction across and within sales territories. You import a fact table named Sales as shown in the exhibit. (Click the Exhibit tab.)The related dimension tables are imported into the model. Sales contains the data shown in the following table.
You are evaluating how to optimize the model. For each of the following statements, select Yes if the statement is true. Otherwise, select No. NOTE: Each correct selection is worth one point. Hot Area:

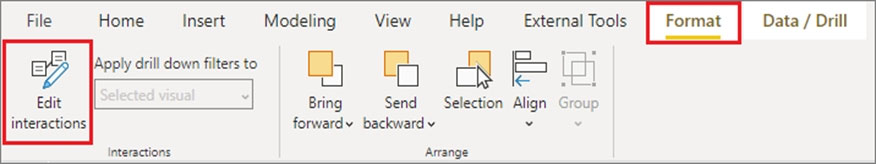
You have a report that contains a donut chart and a clustered column chart. Interactions between the visuals use the default settings.
You need to modify the report so that when you select a column in the column chart, the donut chart redraws by using the data from the selected column.
What should you do?
A. Select the donut chart and set the column chart interaction to Filter.
B. Select the column chart and set the donut chart interaction to Filter.
C. Select the donut chart and set the column chart interaction to None.
D. Select the column chart and set the donut chart interaction to None.

You import two Microsoft Excel tables named Customer and Address into Power Query. Customer contains the following columns:
✑ Customer ID
✑ Customer Name
✑ Phone
✑ Email Address
✑ Address ID
Address contains the following columns:
✑ Address ID
✑ Address Line 1
✑ Address Line 2
✑ City
✑ State/Region
✑ Country
✑ Postal Code
Each Customer ID represents a unique customer in the Customer table. Each Address ID represents a unique address in the Address table.
You need to create a query that has one row per customer. Each row must contain City, State/Region, and Country for each customer.
What should you do?
A. Merge the Customer and Address tables.
B. Group the Customer and Address tables by the Address ID column.
C. Transpose the Customer and Address tables.
D. Append the Customer and Address tables.

You have a dashboard that contains tiles pinned from a single report as shown in the Original Dashboard exhibit. (Click the Original Dashboard tab.)You need to modify the dashboard to appear as shown in the Modified Dashboard exhibit. (Click the Modified Dashboard tab.)
What should you do?
A. Change the report theme.
B. Change the dashboard theme.
C. Edit the details of each tile.
D. Create a custom CSS file.
You use Power Query Editor to import and preview sales data from the years 2020 and 2021 in a Microsoft Excel file as shown in the following exhibit.You need to shape the query to display the following three columns: • Month • Sales • Year What should you select in Power Query Editor?
A. Merge columns
B. Transpose
C. Unpivot columns
D. Pivot column
You need to create a Power BI theme that will be used in multiple reports. The theme will include corporate branding for font size, color, and bar chart formatting.
What should you do?
A. From Power BI Desktop, customize the current theme.
B. From Power BI Desktop, use a built-in report theme.
C. Create a theme as a PBIVIZ file and import the theme into Power BI Desktop.
D. Create a theme as a JSON file and import the theme into Power BI Desktop.
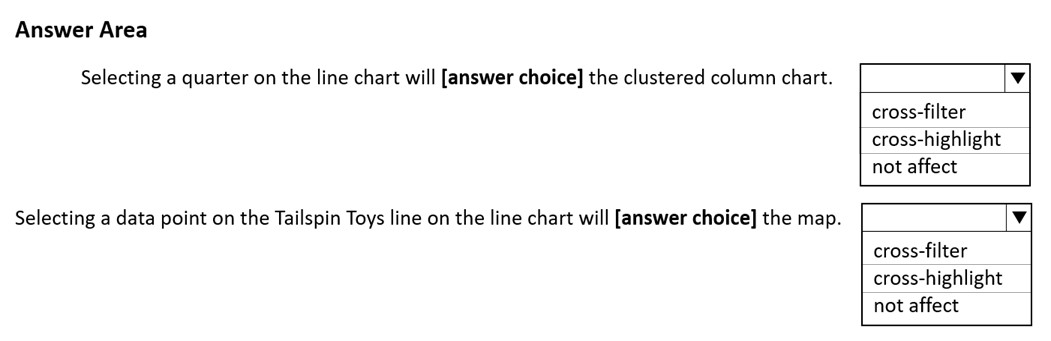
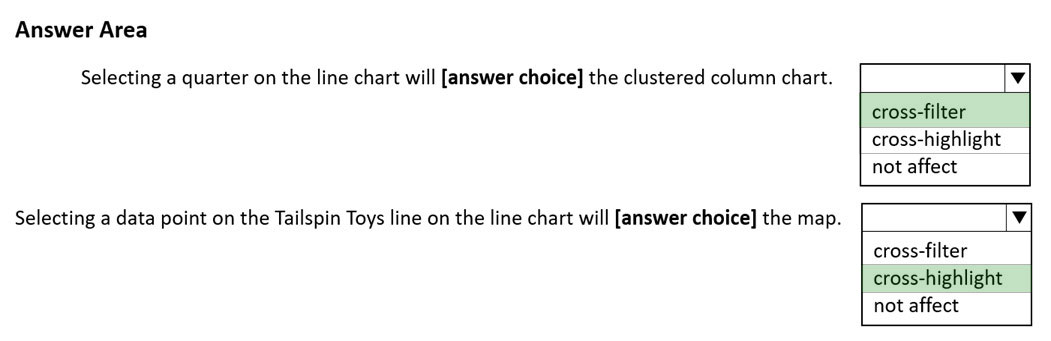
HOTSPOT - You have a report page that contains the visuals shown in the following exhibit.Use the drop-down menus to select the answer choice that completes each statement based on the information presented in the graphic. NOTE: Each correct selection is worth one point. Hot Area:


You need to ensure that the data is updated to meet the report requirements. The solution must minimize configuration effort.
What should you do?
A. From each report in powerbi.com, select Refresh visuals.
B. From Power BI Desktop, download the PBIX file and refresh the data.
C. Configure a scheduled refresh without using an on-premises data gateway.
D. Configure a scheduled refresh by using an on-premises data gateway.
HOTSPOT
-
You have a folder that contains 50 JSON files.
You need to use Power BI Desktop to make the metadata of the files available as a single dataset. The solution must NOT store the data of the JSON files.
Which type of data source should you use, and which transformation should you perform? To answer, select the appropriate options in the answer area.
NOTE: Each correct selection is worth one point.


Overview - Northwind Traders is a specialty food import company. The company recently implemented Power BI to better understand its top customers, products, and suppliers. Business Issues - The sales department relies on the IT department to generate reports in Microsoft SQL Server Reporting Services (SSRS). The IT department takes too long to generate the reports and often misunderstands the report requirements. Existing Environment. Data Sources Northwind Traders uses the data sources shown in the following table.Source2 is exported daily from a third-party system and stored in Microsoft SharePoint Online. Existing Environment. Customer Worksheet Source2 contains a single worksheet named Customer Details. The first 11 rows of the worksheet are shown in the following table.
All the fields in Source2 are mandatory. The Address column in Customer Details is the billing address, which can differ from the shipping address. Existing Environment. Azure SQL Database Source1 contains the following tables: Orders Products Suppliers Categories Order Details Sales Employees The Orders table contains the following columns.
The Order Details table contains the following columns.
The address in the Orders table is the shipping address, which can differ from the billing address. The Products table contains the following columns.
The Categories table contains the following columns.
The Suppliers table contains the following columns.
The Sales Employees table contains the following columns.
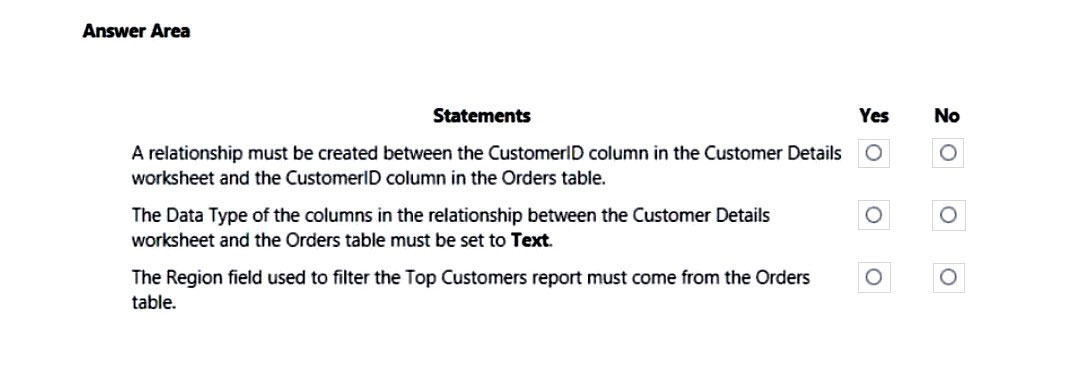
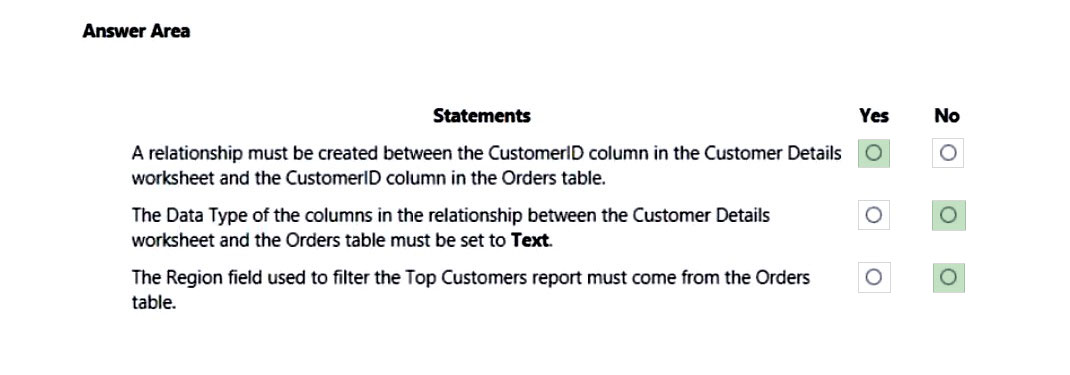
Each employee in the Sales Employees table is assigned to one sales region. Multiple employees can be assigned to each region. Requirements. Report Requirements Northwind Traders requires the following reports: Top Products Top Customers On-Time Shipping The Top Customers report will show the top 20 customers based on the highest sales amounts in a selected order month or quarter, product category, and sales region. The Top Products report will show the top 20 products based on the highest sales amounts sold in a selected order month or quarter, sales region, and product category. The report must also show which suppliers provide the top products. The On-Time Shipping report will show the following metrics for a selected shipping month or quarter: The percentage of orders that were shipped late by country and shipping region Customers that had multiple late shipments during the last quarter Northwind Traders defines late orders as those shipped after the required shipping date. The warehouse shipping department must be notified if the percentage of late orders within the current month exceeds 5%. The reports must show historical data for the current calendar year and the last three calendar years. Requirements. Technical Requirements Northwind Traders identifies the following technical requirements: A single dataset must support all three reports. The reports must be stored in a single Power BI workspace. Report data must be current as of 7 AM Pacific Time each day. The reports must provide fast response times when users interact with a visualization. The data model must minimize the size of the dataset as much as possible, while meeting the report requirements and the technical requirements. Requirements. Security Requirements Access to the reports must be granted to Azure Active Directory (Azure AD) security groups only. An Azure AD security group exists for each department. The sales department must be able to perform the following tasks in Power BI: Create, edit, and delete content in the reports. Manage permissions for workspaces, datasets, and reports. Publish, unpublish, update, and change the permissions for an app. Assign Azure AD groups role-based access to the reports workspace. Users in the sales department must be able to access only the data of the sales region to which they are assigned in the Sales Employees table. Power BI has the following row-level security (RLS) Table filter DAX expression for the Sales Employees table. [EmailAddress] = USERNAME() RLS will be applied only to the sales department users. Users in all other departments must be able to view all the data. HOTSPOT - You need to design the data model and the relationships for the Customer Details worksheet and the Orders table by using Power BI. The solution must meet the report requirements. For each of the following statements, select Yes if the statement is true. Otherwise, select No. NOTE: Each correct selection is worth one point. Hot Area:
DRAG DROP - You receive annual sales data that must be included in Power BI reports. From Power Query Editor, you connect to the Microsoft Excel source shown in the following exhibit.You need to create a report that meets the following requirements: • Visualizes the Sales value over a period of years and months • Adds a slicer for the month • Adds a slicer for the year Which three actions should you perform in sequence? To answer, move the appropriate actions from the list of actions to the answer area and arrange them in the correct order.


You have a Power BI report that contains the visuals shown in the following table.You need to modify the location of each visual. What should you modify for each visual?
A. the layer order
B. the padding
C. the position
D. the tab order
HOTSPOT
-
You are creating a Power BI model in Power BI Desktop.
You need to create a calculated table named Numbers that will contain all the integers from -100 to 100.
How should you complete the DAX calculation? To answer, select the appropriate options in the answer area.
NOTE: Each correct selection is worth one point.


In Power Query Editor, you have a query named Sales Data that contains the following columns.You need to create two queries named Product Dimension and Sales Fact based on the Sales Data query. The solution must minimize maintenance effort and the size of the dataset. Which two actions should you perform? Each correct answer presents part of the solution. NOTE: Each correct selection is worth one point.
A. Reference the Sales Data query to create the new queries.
B. Disable the load for the Sales Fact query.
C. Duplicate the Sales Data query to create the new queries.
D. Clear Include in report refresh for the Sales Data query.
E. Disable the load for the Sales Data query.
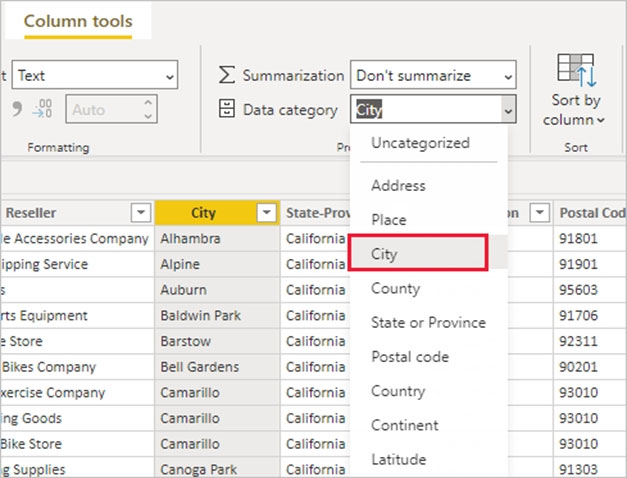
You are building a Power BI report.
Users will view the report by using their mobile device.
You need to configure the report to display data based on each user's location.
Which two actions should you perform? Each correct answer presents part of the solution.
NOTE: Each correct selection is worth one point.
A. From Power Query Editor, detect the data types of the relevant columns.
B. In Data Category, set the geographic data category for the relevant columns.
C. Create a hierarchy for columns of the geography data type.
D. Use the columns of the geography data type in all visuals.
E. For the relevant columns, set synonyms to match common geographical terms.
DRAG DROP
-
You publish a dataset that contains data from an on-premises Microsoft SQL Server database.
The dataset must be refreshed daily.
You need to ensure that the Power BI service can connect to the database and refresh the dataset.
Which four actions should you perform in sequence? To answer, move the appropriate actions from the list of actions to the answer area and arrange them in the correct order.


DRAG DROP
-
You need to use AI insights to add a column of enhanced data based on the customer feedback. The solution must identify the following:
•	What the customers most often provide feedback about
•	Whether the customers like your company’s product
•	The language of the feedback
Which AI insights service should you use for each output? To answer, drag the appropriate services to the correct outputs. Each service may be used once, more than once, or not at all. You may need to drag the split bar between panes or scroll to view content.
NOTE: Each correct selection is worth one point.


You have a Power BI model that contains a table named Date. The Date table contains the following columns:
•	Date
•	Fiscal Year
•	Fiscal Quarter
•	Month Name
•	Calendar Year
•	Week Number
•	Month Number
•	Calendar Quarter
You need to create a calculated table based on the Date table. The calculated table must contain only unique combinations of values for Calendar Year, Calendar Quarter, and Calendar Month.
Which DAX function should you include in the table definition?
A. ADDCOLUMNS
B. CALCULATE
C. SUMMARIZE
D. DATATABLE
Overview - Litware, Inc. is an online retailer that uses Power BI. Litware plans to leverage data from an Azure SQL database that stores data for the company's live e-commerce website. Litware uses Azure Active Directory (Azure AD) to authenticate users. Existing Environment. Sales Data Litware has online sales data that has the SQL schema shown in the following table.
A. a one-to-many relationship from Date[date_id] to Sales[sales_date_id] and another one-to-many relationship from Date[date_id] to Weekly_Returns[week_id]
B. a one-to-many relationship from Sales[sales_date_id] to Date[date_id] and a one-to-many relationship from Sales[sales_ship_date_id] to Date[date_id]
C. an additional date table named ShipDate, a many-to-many relationship from Sales[sales_date_id] to Date[date_id], and a many-to-many relationship from Sales[sales_ship_date_id] to ShipDate[date_id]
D. an additional date table named ShipDate, a one-to-many relationship from Date[date_id] to Sales[sales_date_id], and a one-to-many relationship from ShipDate[date_id] to Sales[sales_skip_date_id]
You have a Power BI data model that analyzes product sales over time. The data model contains the following tables.A one-to-many relationship exists between the tables. The auto date/time option for the data model is enabled. You need to reduce the size of the data model while maintaining the ability to analyze product sales by month and quarter. Which two actions should you perform? Each correct answer presents part of the solution. NOTE: Each correct answer is worth one point.
A. Create a relationship between the Date table and the Sales table.
B. Disable the auto date/time option.
C. Create a Date table and select Mark as Date Table.
D. Disable the load on the Date table.
E. Remove the relationship between the Product table and the Sales table.
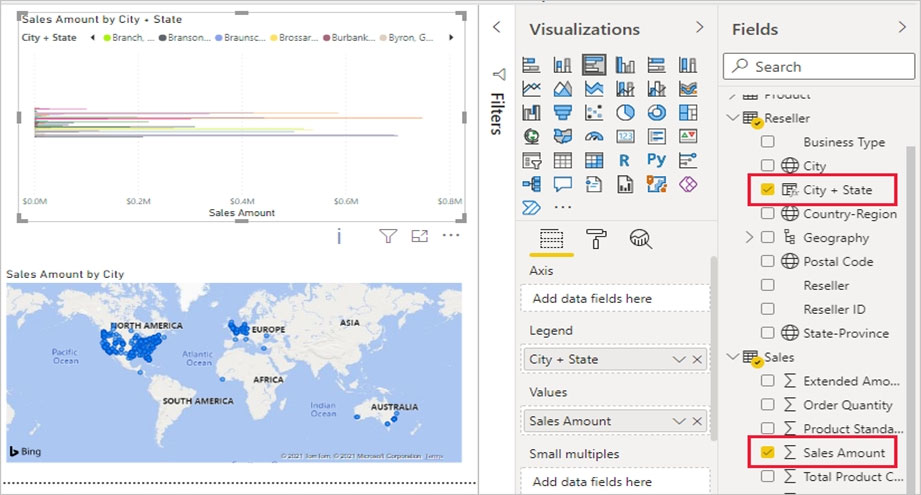
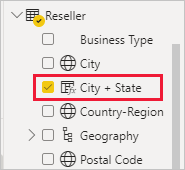
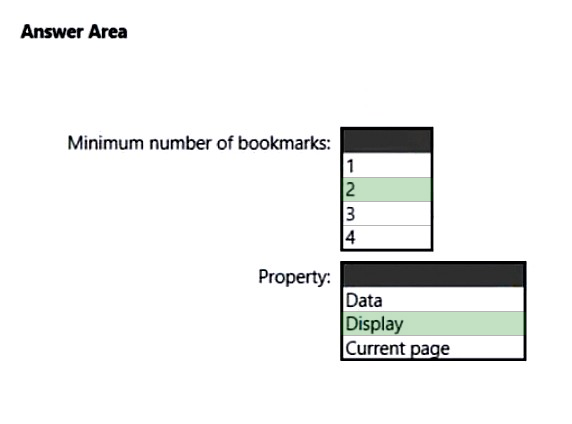
HOTSPOT - You need to create a Power BI report. The first page of the report must contain the following two views: ✑ Sales By Postal Code ✑ Sales by Month Both views must display a slicer to select a value for a field named Chain. The Sales By Postal Code view must display a map visual as shown in the following exhibit.The Sales By Month view must display a column chart visual as shown in the following exhibit.
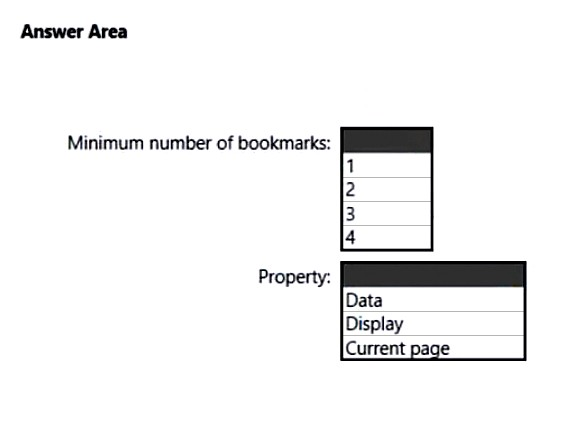
Users must be able to switch between the views by using buttons on the report page. The selected Chain field must be maintained when switching between views. What is the minimum number of bookmarks required, and which property should you apply to each bookmark? To answer, select the appropriate options in the answer area. NOTE: Each correct selection is worth one point. Hot Area:
You have the Power BI data model shown in the following exhibit.
A. Calculate (Sum(Sales[Sales]), PREVIOUSYEAR( dimDate[Date])
B. TOTALYTD (SUM(Sales[Sales]), dimDate[Date] )
C. Calculate (SUM(Sales[Sales]), SAMEPERIODLASTYEAR(dimDate[Date] ))
D. SUM(Sales[Sales])
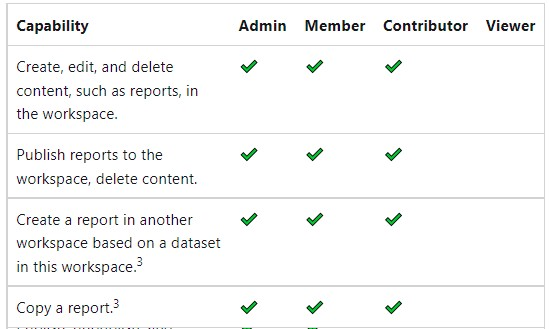
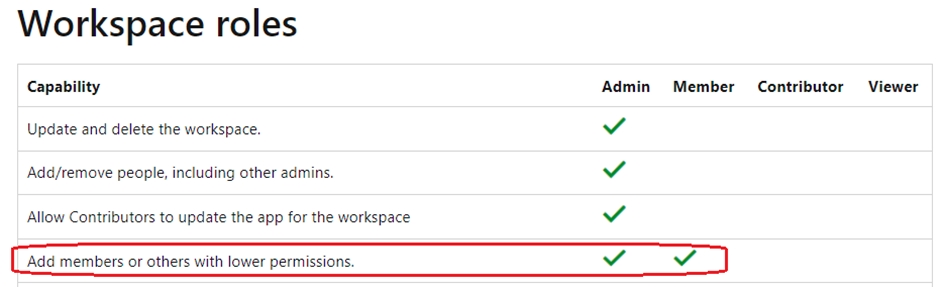
You need to provide a user with the ability to add members to a workspace. The solution must use the principle of least privilege.
Which role should you assign to the user?
A. Viewer
B. Admin
C. Contributor
D. Member
Access Full PL-300 Mock Test Free
Want a full-length mock test experience? Click here to unlock the complete PL-300 Mock Test Free set and get access to hundreds of additional practice questions covering all key topics.
We regularly update our question sets to stay aligned with the latest exam objectives—so check back often for fresh content!
Start practicing with our PL-300 mock test free today—and take a major step toward exam success!