
PL-300 Dump Free – 50 Practice Questions to Sharpen Your Exam Readiness.
Looking for a reliable way to prepare for your PL-300 certification? Our PL-300 Dump Free includes 50 exam-style practice questions designed to reflect real test scenarios—helping you study smarter and pass with confidence.
Using an PL-300 dump free set of questions can give you an edge in your exam prep by helping you:
- Understand the format and types of questions you’ll face
- Pinpoint weak areas and focus your study efforts
- Boost your confidence with realistic question practice
Below, you will find 50 free questions from our PL-300 Dump Free collection. These cover key topics and are structured to simulate the difficulty level of the real exam, making them a valuable tool for review or final prep.
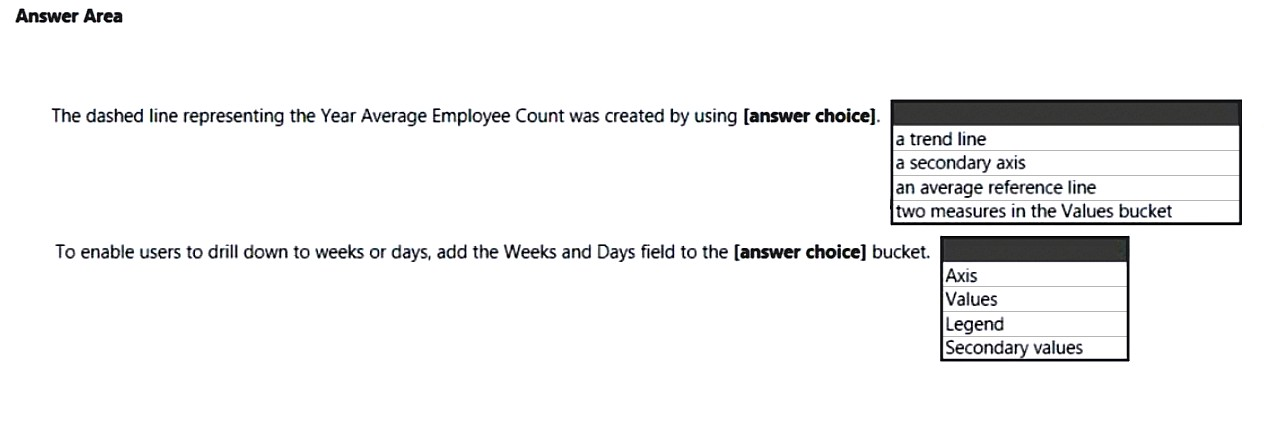
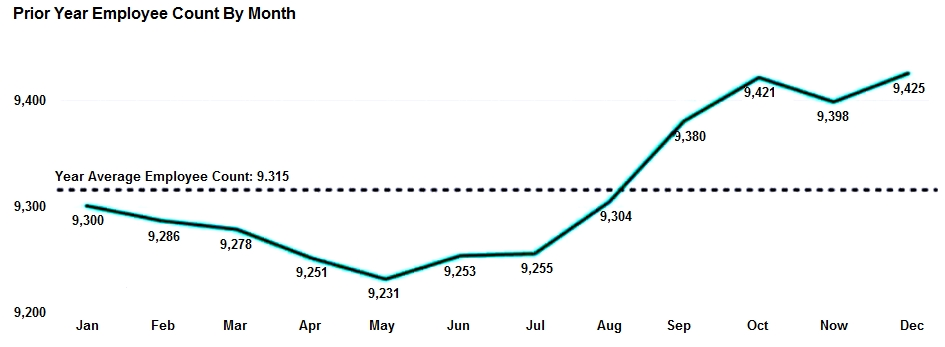
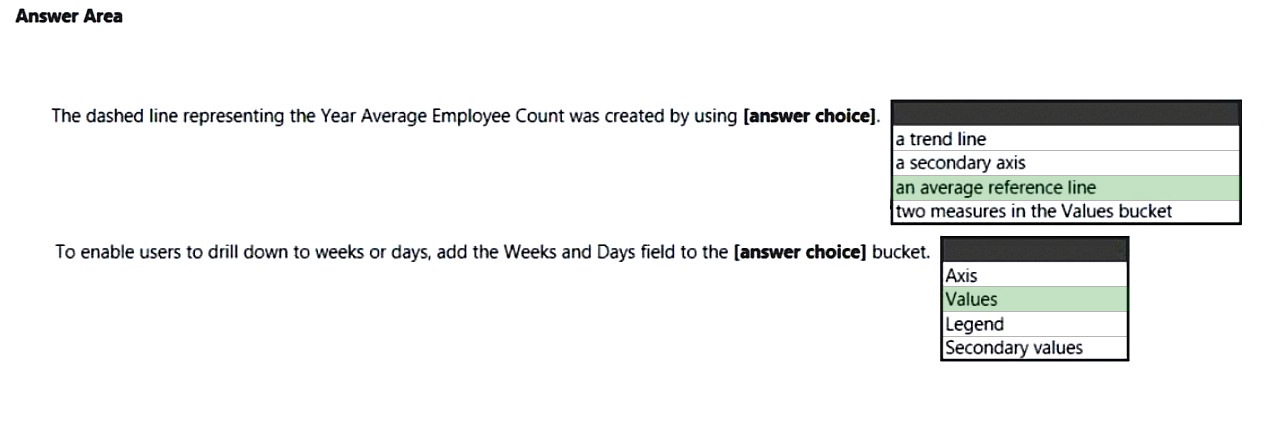
HOTSPOT -

You are creating a line chart in a Power BI report as shown in the following exhibit.


Use the drop-down menus to select the answer choice that completes each statement based on the information presented in the graphic.

NOTE: Each correct selection is worth one point.

Hot Area:
HOTSPOT -
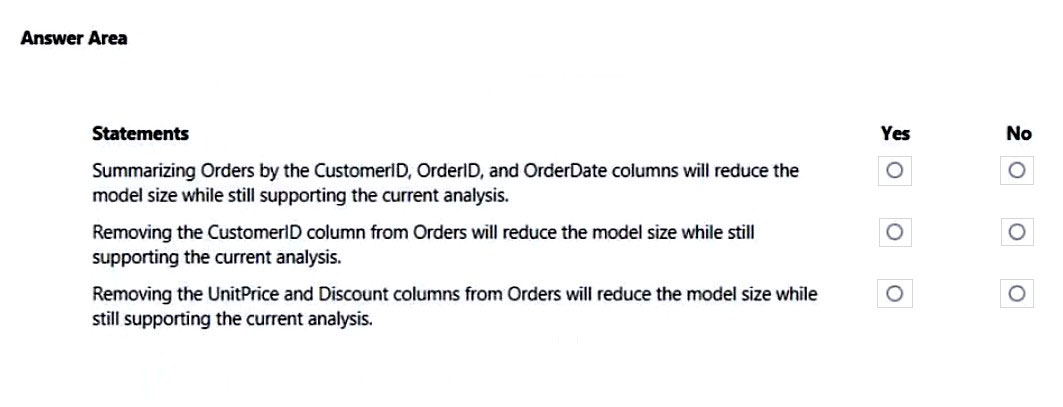
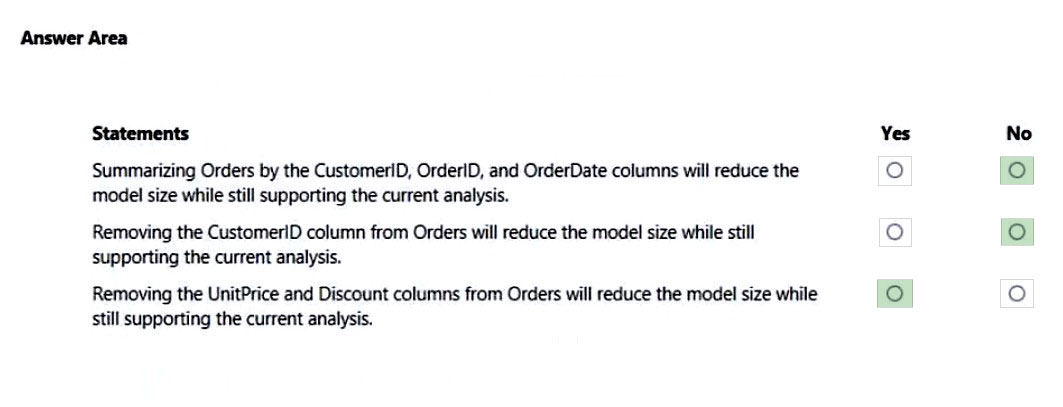
You have a Power BI report named Orders that supports the following analysis:
✑ Total sales over time
✑ The count of orders over time
✑ New and repeat customer counts
The data model size is nearing the limit for a dataset in shared capacity.
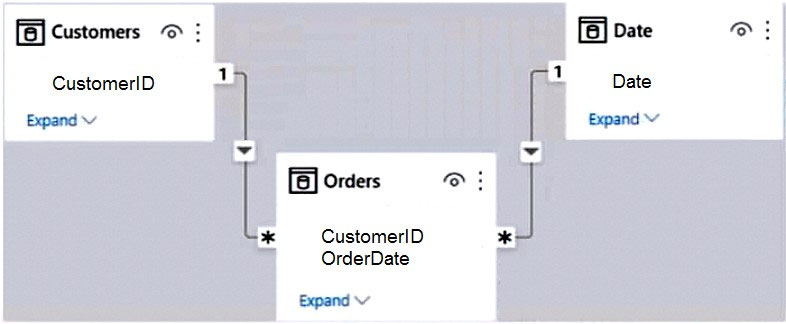
The model view for the dataset is shown in the following exhibit.
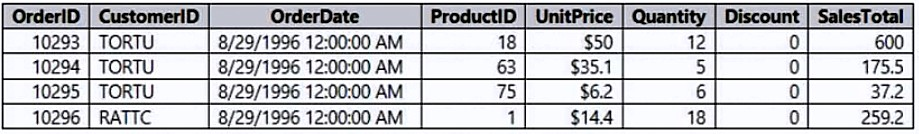
The data view for the Orders table is shown in the following exhibit.
The Orders table relates to the Customers table by using the CustomerID column.
The Orders table relates to the Date table by using the OrderDate column.
For each of the following statements, select Yes if the statement is true, Otherwise, select No.
NOTE: Each correct selection is worth one point.
Hot Area:
You publish a dataset to the Power BI service. The dataset contains a connection to an on-premises Microsoft SQL Server database.
You attempt to configure a scheduled refresh but cannot select the appropriate on-premises data gateway.
You confirm the following with the administrator of the gateway:
• You have the appropriate permissions to use the gateway.
• The data source was created on the gateway.
• The gateway has a status of Running.
What is the most likely reason the gateway is unavailable?A. The type of data source is not supported by the on-premises data gateway.
B. The server name in the PBIX file does not match the data source name in the gateway.
C. The credentials for the data source are invalid.
D. The data source is configured to use single sign-on (SSO).
You need to create the On-Time Shipping report. The report must include a visualization that shows the percentage of late orders.
Which type of visualization should you create?A. pie chart
B. scatterplot
C. bar chart
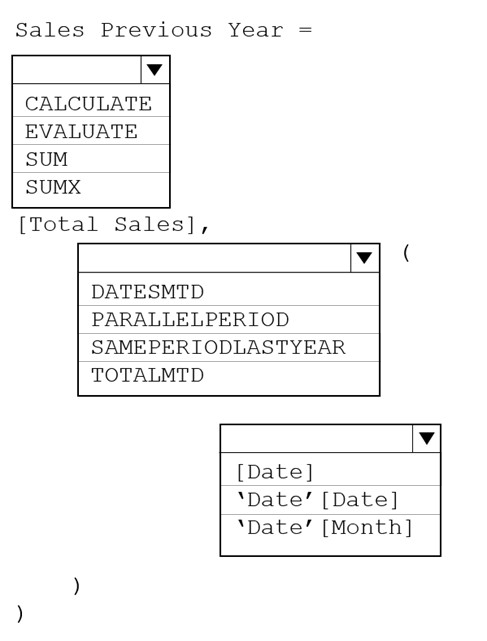
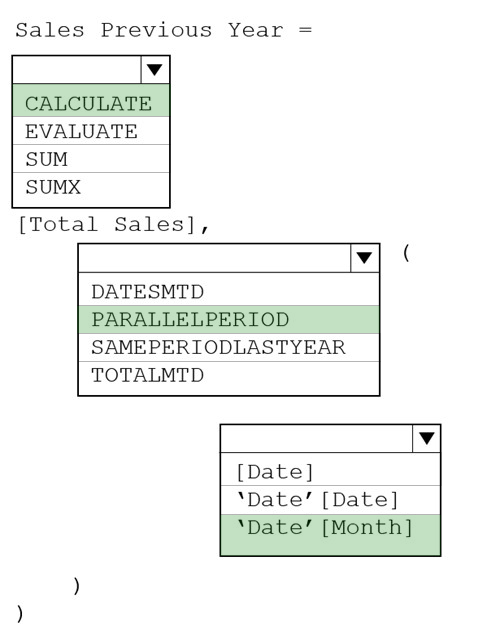
HOTSPOT -

You have a Power BI model that contains a table named Sales and a related date table. Sales contains a measure named Total Sales.

You need to create a measure that calculates the total sales from the equivalent month of the previous year.

How should you complete the calculation? To answer, select the appropriate options in the answer area.

NOTE: Each correct selection is worth one point.

Hot Area:
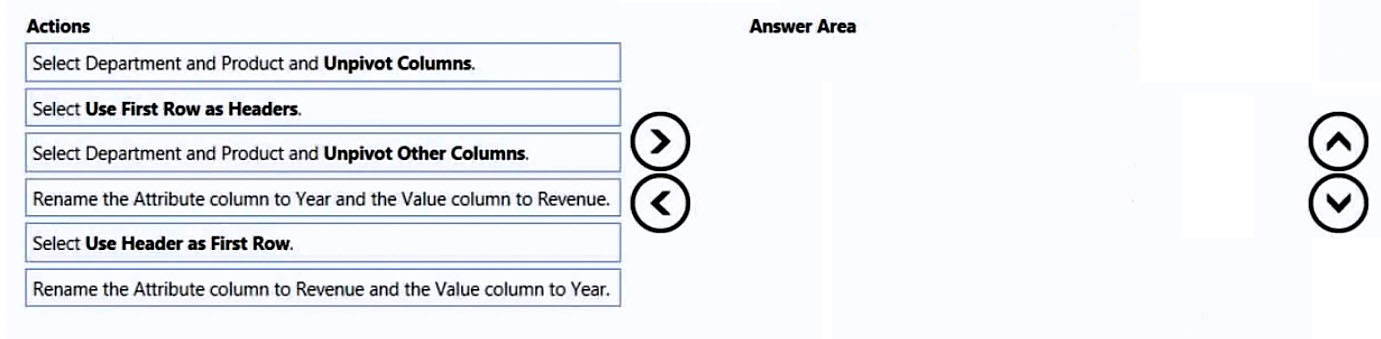
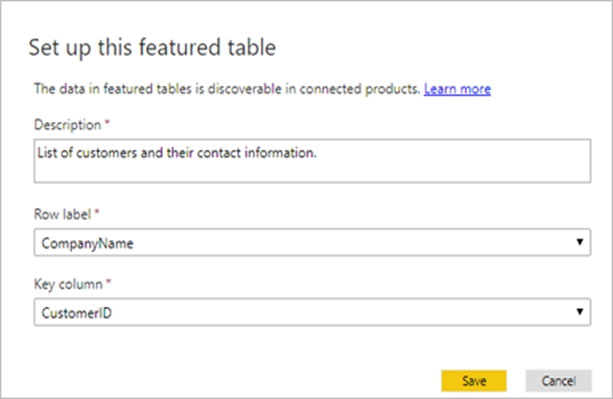
DRAG DROP -

You are preparing a financial report in Power BI.

You connect to the data stored in a Microsoft Excel spreadsheet by using Power Query Editor as shown in the following exhibit.


You need to prepare the data to support the following:

✑ Visualizations that include all measures in the data over time

✑ Year-over-year calculations for all the measures

Which four actions should you perform in sequence? To answer, move the appropriate actions from the list of actions to the answer area and arrange them in the correct order.

Select and Place:

You have a Microsoft Power BI data model that contains three tables named Orders, Date, and City. There is a one-to-many relationship between Date and
Orders and between City and Orders.
The model contains two row-level security (RLS) roles named Role1 and Role2. Role1 contains the following filter.
City[State Province] = "Kentucky"
Role2 contains the following filter.
Date[Calendar Year] = 2020 -
If a user is a member of both Role1 and Role2, what data will they see in a report that uses the model?A. The user will see data for which the State Province value is Kentucky or where the Calendar Year is 2020.
B. The user will receive an error and will not be able to see the data in the report.
C. The user will only see data for which the State Province value is Kentucky.
D. The user will only see data for which the State Province value is Kentucky and the Calendar Year is 2020.
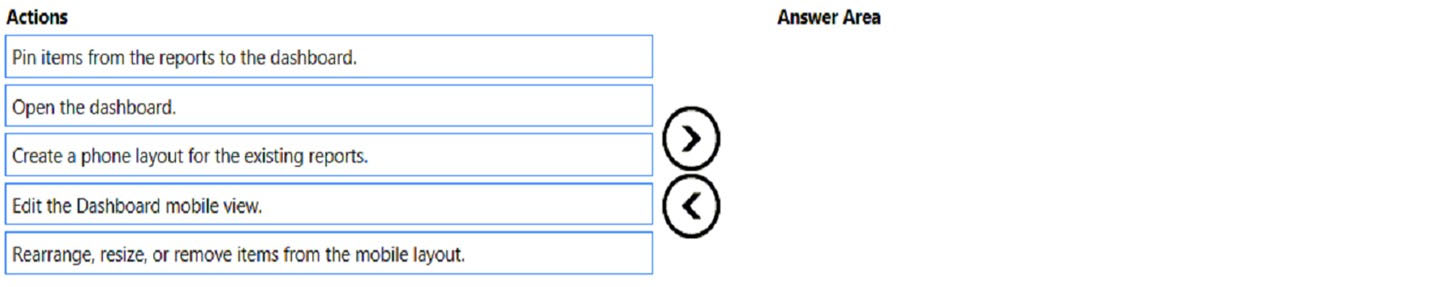
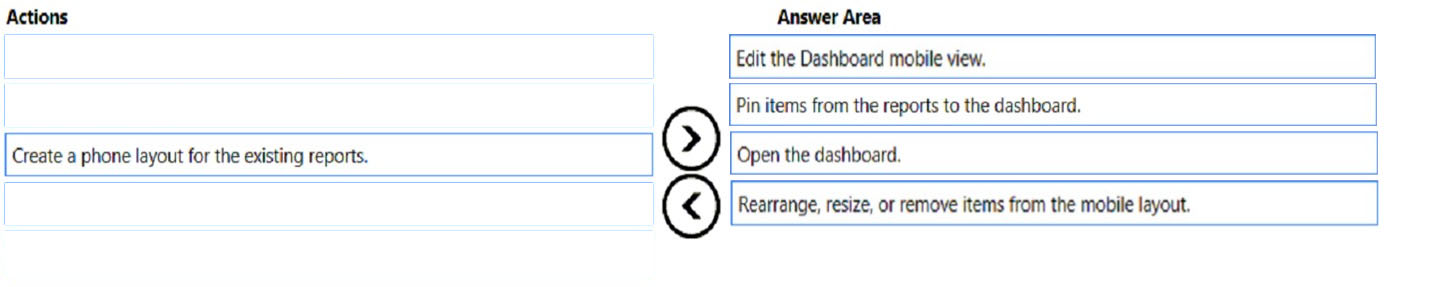
DRAG DROP -

You are using existing reports to build a dashboard that will be viewed frequently in portrait mode on mobile phones.

You need to build the dashboard.

Which four actions should you perform in sequence? To answer, move the appropriate actions from the list of actions to the answer area and arrange them in the correct order.

Select and Place:
DRAG DROP

-

You have a Power BI report that contains a table visual with a measure named Revenue. The Revenue measure returns values within a range of 0 to 5.

You need to format the visual so that the Revenue column displays a specific background color based on the value range shown in the following table.


Which three actions should you perform in sequence in Power BI Desktop? To answer, move the appropriate actions from the list of actions to the answer area and arrange them in the correct order.


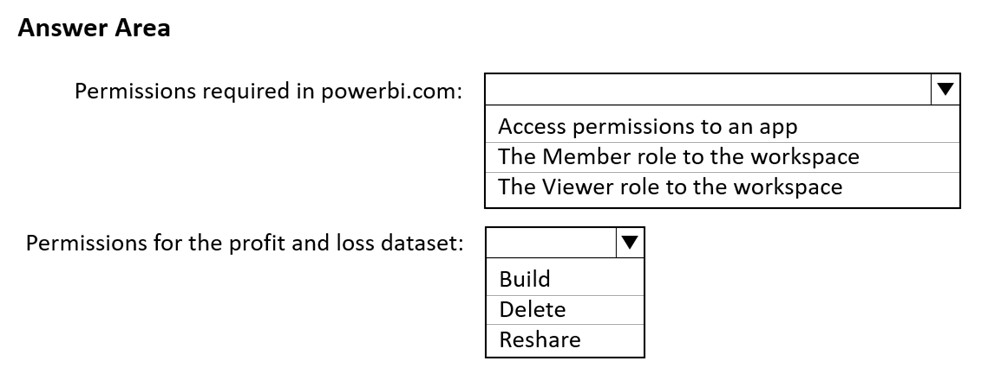
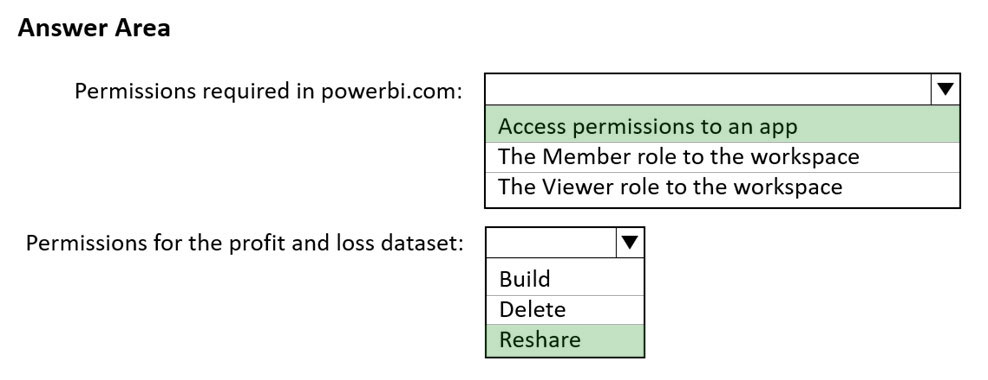
HOTSPOT -

You need to grant access to the business unit analysts.

What should you configure? To answer, select the appropriate options in the answer area.

NOTE: Each correct selection is worth one point.

Hot Area:
You need to create a Power BI theme that will be used in multiple reports. The theme will include corporate branding for font size, color, and bar chart formatting.
What should you do?A. From Power BI Desktop, customize the current theme.
B. From Power BI Desktop, use a built-in report theme.
C. Create a theme as a PBIVIZ file and import the theme into Power BI Desktop.
D. Create a theme as a JSON file and import the theme into Power BI Desktop.
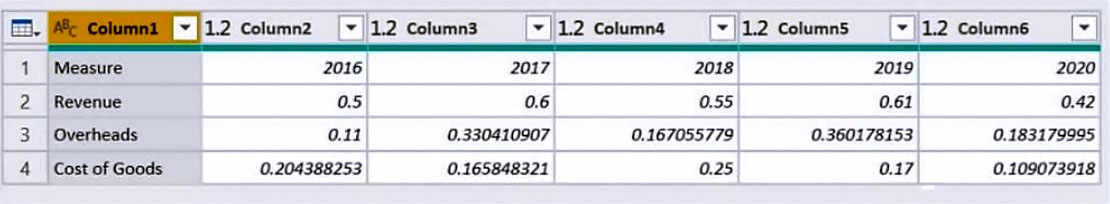
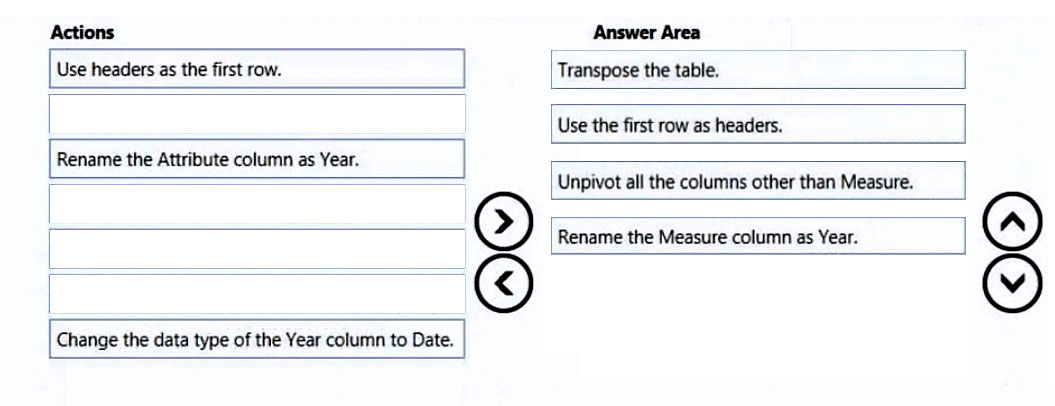
DRAG DROP -
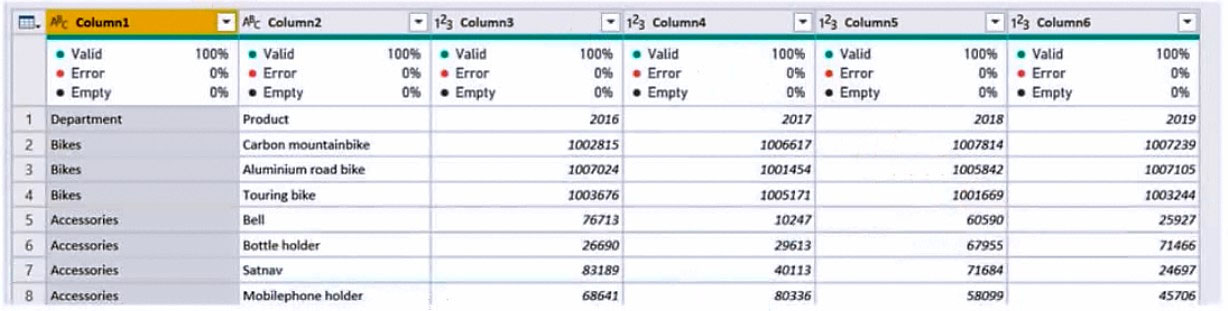
You receive revenue data that must be included in Microsoft Power BI reports.
You preview the data from a Microsoft Excel source in Power Query as shown in the following exhibit.
You plan to create several visuals from the data, including a visual that shows revenue split by year and product.
You need to transform the data to ensure that you can build the visuals. The solution must ensure that the columns are named appropriately for the data that they contain.
Which three actions should you perform in sequence? To answer, move the appropriate actions from the list of actions to the answer area and arrange them in the correct order.
Select and Place:

You build a Power BI report that displays IoT temperature data streaming from a refrigerator.
You publish the report to the Power BI service.
You need to be notified when the temperature rises above four degrees Celsius.
What should you do?A. Set an alert on a KPI visual in the report.
B. Pin a card visual to a dashboard and create a subscription.
C. Pin a card visual to a dashboard and set an alert on the tile.
D. Pin a report page to a dashboard and set an alert on the page.
You create a report by using Microsoft Power BI Desktop.
The report uses data from a Microsoft SQL Server Analysis Services (SSAS) cube located on your company's internal network.
You plan to publish the report to the Power BI Service.
What should you implement to ensure that users who consume the report from the Power BI Service have the most up-to-date data from the cube?A. an OData feed
B. an On-premises data gateway
C. a subscription
D. a scheduled refresh of the dataset
Note: This question is part of a series of questions that present the same scenario. Each question in the series contains a unique solution that might meet the stated goals. Some question sets might have more than one correct solution, while others might not have a correct solution.
After you answer a question in this section, you will NOT be able to return to it. As a result, these questions will not appear in the review screen.
You have a Power BI report that imports a date table and a sales table from an Azure SQL database data source. The sales table has the following date foreign keys:
• Due Date
• Order Date
• Delivery Date
You need to support the analysis of sales over time based on all three dates at the same time.
Solution: From the Fields pane, you rename the date table as Due Date. You use a DAX expression to create Order Date and Delivery Date as calculated tables. You create active relationships between the sales table and each date table.
Does this meet the goal?A. Yes
B. No
DRAG DROP -

You are preparing a financial report in Power BI.

You connect to the data stored in a Microsoft Excel spreadsheet by using Power Query Editor as shown in the following exhibit.


You need to prepare the data to support the following:

✑ Visualizations that include all measures in the data over time

✑ Year-over-year calculations for all the measures

Which four actions should you perform in sequence? To answer, move the appropriate actions from the list of actions to the answer area and arrange them in the correct order.

Select and Place:
You use Power Query Editor to preview a query that contains sales order data in the following columns:
• Tax Amount
• Sales Order ID
• Freight Amount
• Subtotal Amount
• Total Item Quantity
The Sales Order ID column uniquely identifies each sales order. The Subtotal Amount and Total Item Quantity columns are always populated, but the Tax Amount and Freight Amount columns are sometimes null when an order has no associated amount.
You need to query the data to identify the following metrics by month:
• The average item quantity per order
• The average freight amount per order
• The maximum item quantity per order
How should you modify the query?A. In the Total Item Quantity column, replace the null values with 0.
B. In the Tax Amount column, remove rows that contain null values.
C. In the Freight Amount column, remove rows that contain null values.
D. In the Freight Amount column, replace the null values with 0.
DRAG DROP

-

You have a Power BI report that contains three pages. The pages are used to analyze sales across various countries.

You add a slicer named Country to each page of the report.

You need to configure the report to meet the following requirements:

•	When a user selects a country on the first page, the report must filter the other pages.

•	The second and third pages must display only the filtered results.

Which task should you perform for each requirement? To answer, drag the appropriate task to the correct requirement. Each task may be used once, more than once, or not at all. You may need to drag the split bar between panes or scroll to view content.

NOTE: Each correct selection is worth one point.


What should you create to meet the reporting requirements of the sales department?A. a measure that uses a formula of COUNTROWS(Sales)
B. a calculated column that use a formula of COUNTA(Sales[sales_id])
C. a calculated column that uses a formula of SUM(Sales[sales_id])
D. a measure that uses a formula of SUM(Sales[sales_id])
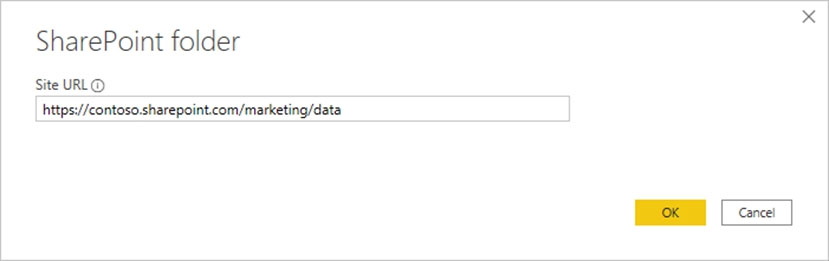
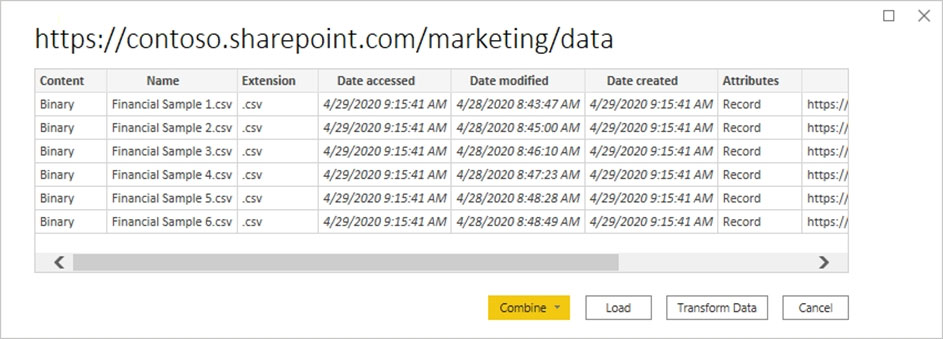
For the sales department at your company, you publish a Power BI report that imports data from a Microsoft Excel file located in a Microsoft SharePoint folder.
The data model contains several measures.
You need to create a Power BI report from the existing data. The solution must minimize development effort.
Which type of data source should you use?A. Power BI dataset
B. a SharePoint folder
C. Power BI dataflows
D. an Excel workbook
You are reviewing a Power BI data model.
You have a calculated table that has the following definition.
ProductList = INTERSECT ( ProductsGroupA, ProductsGroupB )
You need to identify the results of the DAX expression.
Which rows will be returned in ProductList?A. all the rows in ProductsGroupB that have a matching row in ProductsGroupA
B. all the rows in both tables
C. all the rows in ProductsGroupA that have a matching row in ProductsGroupB
D. all the rows in ProductsGroupA that have no matching row in ProductsGroupB.
Note: This question is part of a series of questions that present the same scenario. Each question in the series contains a unique solution that might meet the stated goals. Some question sets might have more than one correct solution, while others might not have a correct solution.
After you answer a question in this section, you will NOT be able to return to it. As a result, these questions will not appear in the review screen.
You are modeling data by using Microsoft Power BI. Part of the data model is a large Microsoft SQL Server table named Order that has more than 100 million records.
During the development process, you need to import a sample of the data from the Order table.
Solution: From Power Query Editor, you import the table and then add a filter step to the query.
Does this meet the goal?A. Yes
B. No
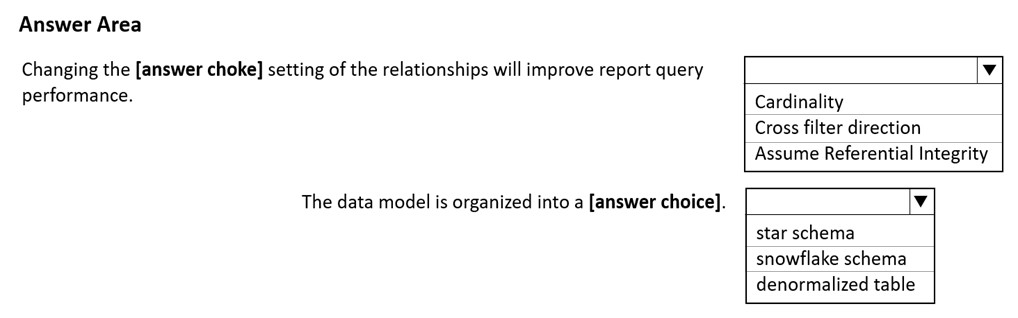
HOTSPOT -

You have a Power BI imported dataset that contains the data model shown in the following exhibit.


Use the drop-down menus to select the answer choice that completes each statement based on the information presented in the graphic.

NOTE: Each correct selection is worth one point.

Hot Area:

You have a Power BI report hosted on powerbi.com that displays expenses by department for department managers.
The report contains a line chart that shows expenses by month.
You need to enable users to choose between viewing the report as a line chart or a column chart. The solution must minimize development and maintenance effort.
What should you do?A. Enable report readers to personalize visuals.
B. Create a separate report page for users to view the column chart.
C. Add a column chart, a bookmark, and a button for users to choose a visual.
D. Create a mobile report that contains a column chart.

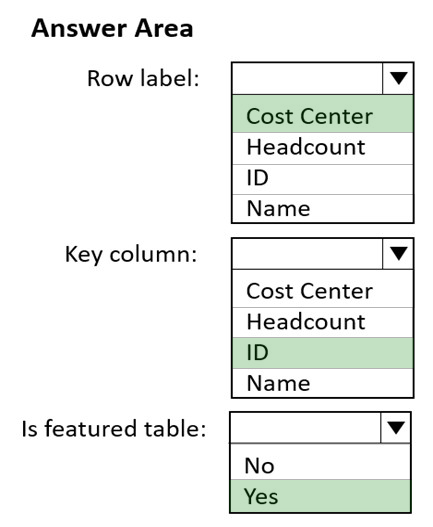
HOTSPOT -

You create a Power BI dataset that contains the table shown in the following exhibit.


You need to make the table available as an organizational data type in Microsoft Excel.

How should you configure the properties of the table? To answer, select the appropriate options in the answer area.

NOTE: Each correct selection is worth one point.

Hot Area:

Note: This question is part of a series of questions that present the same scenario. Each question in the series contains a unique solution that might meet the stated goals. Some question sets might have more than one correct solution, while others might not have a correct solution.
After you answer a question in this section, you will NOT be able to return to it. As a result, these questions will not appear in the review screen.
You have five reports and two dashboards in a workspace.
You need to grant all organizational users read access to one dashboard and three reports.
Solution: You assign all the users the Viewer role to the workspace.
Does this meet the goal?A. Yes
B. No
You are creating a Power BI report by using Power BI Desktop.
You need to include a visual that shows trends and other useful information automatically. The visual must update based on selections in other visuals.
Which type of visual should you use?A. Q&A
B. smart narrative
C. key influencers
D. decomposition tree
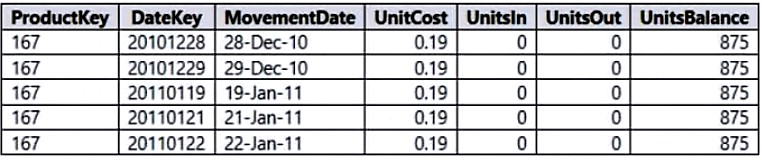
You import a Power BI dataset that contains the following tables:
✑ Date
✑ Product
✑ Product Inventory
The Product Inventory table contains 25 million rows. A sample of the data is shown in the following table.
The Product Inventory table relates to the Date table by using the DateKey column. The Product Inventory table relates to the Product table by using the
ProductKey column.
You need to reduce the size of the data model without losing information.
What should you do?A. Change Summarization for DateKey to Don't Summarize.
B. Remove the relationship between Date and Product Inventory
C. Change the data type of UnitCost to Integer.
D. Remove MovementDate.
You need to minimize the size of the dataset. The solution must meet the report requirements.
What should you do?A. Group the Categories table by the CategoryID column.
B. Remove the QuantityPerUnit column from the Products table.
C. Filter out discontinued products while importing the Products table.
D. Change the OrderID column in the Orders table to the Text data type.
You have a Power BI report that contains a page. The page contains the following:
• A shape named Shape1
• A card named Sales Summary
• A clustered bar chart named Sales by Region
You need to ensure that Sales Summary renders on top of Shape1.
What should you modify?A. Tab order in the Selection pane
B. Layer order in the Selection pane
C. Maintain layer order in the General visual settings
D. Vertical alignment in the Canvas settings
DRAG DROP -

You need create a date table in Power BI that must contain 10 full calendar years, including the current year.

How should you complete the DAX expression? To answer, select the appropriate options in the answer area.

NOTE: Each correct selection is worth one point.

Select and Place:


You have a Power BI model that contains two tables named Population and Date.
The Population table contains two columns named PopulationAmount and DateKey.
DateKey contains date values that represent the first day of a year and are used to create a many-to-one relationship with the Date table.
The Power BI model contains two measures that have the following definitions.
Total Population = Sum(‘Population’[PopulationAmount])
2023 Population = CALCULATE([Total Population], ‘Date'[Year] = 2023)
You create a table visual that displays Date[Year] and [2023 Population].
What will the table visual show?A. one row per year that contains blank values for every year except 2023
B. one row per date that contains the population value for the corresponding year repeated in each row
C. a single row for the year 2023 that contains the related population value
D. one row per year that contains the same value repeated for each year
After you answer a question in this section, you will NOT be able to return to it. As a result, these questions will not appear in the review screen.
You have five reports and two dashboards in a workspace.
You need to grant all organizational users read access to one dashboard and three reports.
Solution: You create an Azure Active Directory group that contains all the users. You share each selected report and the one dashboard to the group.
Does this meet the goal?A. Yes
B. No
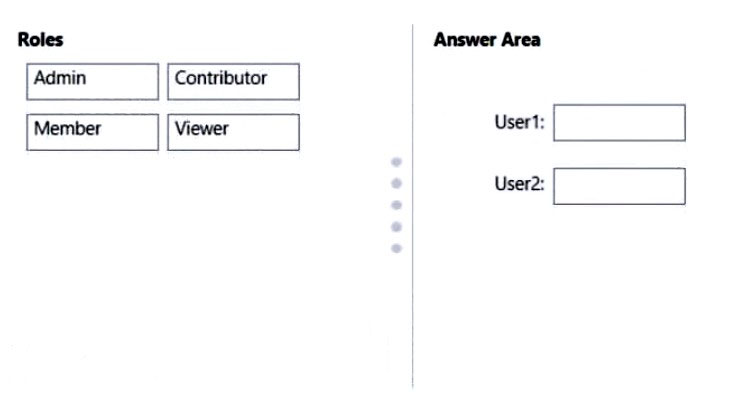
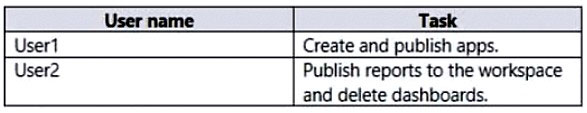
DRAG DROP -

You have a Microsoft Power BI workspace.

You need to grant the user capabilities shown in the following table.


The solution must use the principle of least privilege.

Which user role should you assign to each user? To answer, drag the appropriate roles to the correct users. Each role may be used once, more than once, or not at all. You may need to drag the split bar.

NOTE: Each correct selection is worth one point.

Select and Place:
You have a Power BI dataset that contains quarterly sales performance data.
You need to enable managers to review the data in a format that meets the following requirements:
• Is optimized for printing.
• Renders data in Microsoft Excel, Word, PowerPoint, and PDF formats.
What should you create?A. a template app
B. a dashboard
C. a paginated report
D. an interactive report
You have a Power BI model that contains the following data.
The Date table relates to the Sales table by using the Date columns.
The model contains the following DAX measure.
Total Sales = SUM(Sales[Sale])
You need to create another measure named Previous Quarter to display the sales one quarter before the selected period.
Which DAX calculation should you use?A. CALCULATE ( [Total Sales], DATEADD (Date[Date], -1, QUARTER ) )
B. CALCULATE ( [Total Sales], DATESQTD (Date[Date] ) )
C. TOTALQTD ( [Total Sales], Date[Date] )
D. CALCULATE ( [Total Sales], PARALLELPERIOD (Date[Date], 1, QUARTER ) )

In Power BI Desktop, you are creating visualizations in a report based on an imported dataset.
You need to allow Power BI users to export the summarized data used to create the visualizations but prevent the users from exporting the underlying data.
What should you do?A. From the Power BI service, configure the dataset permissions.
B. From Power BI Desktop, configure the Data Load settings for the current file.
C. From Power BI Desktop, modify the data source permissions.
D. From Power BI Desktop, configure the Report settings for the current file.
You have a Power BI model that contains the following data.
The Date table relates to the Sales table by using the Date columns.
The model contains the following DAX measure.
Total Sales = SUM(Sales[Sale])
You need to create another measure named Previous Quarter to display the sales one quarter before the selected period.
Which DAX calculation should you use?A. CALCULATE ( [Total Sales], DATEADD (Date[Date], -1, QUARTER ) )
B. CALCULATE ( [Total Sales], DATESQTD (Date[Date] ) )
C. TOTALQTD ( [Total Sales], Date[Date] )
D. CALCULATE ( [Total Sales], PARALLELPERIOD (Date[Date], 1, QUARTER ) )
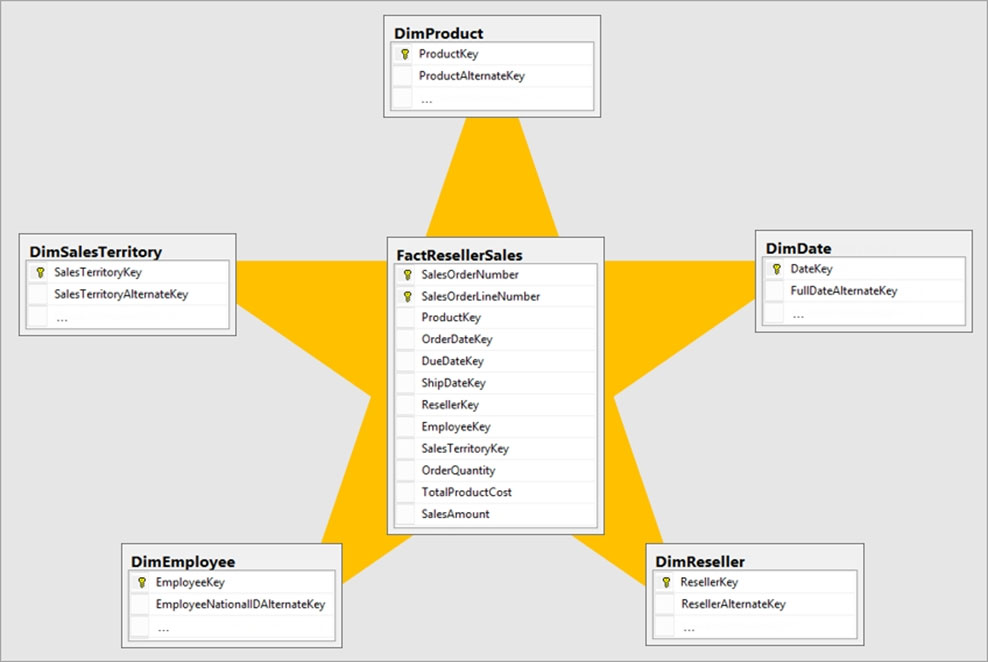
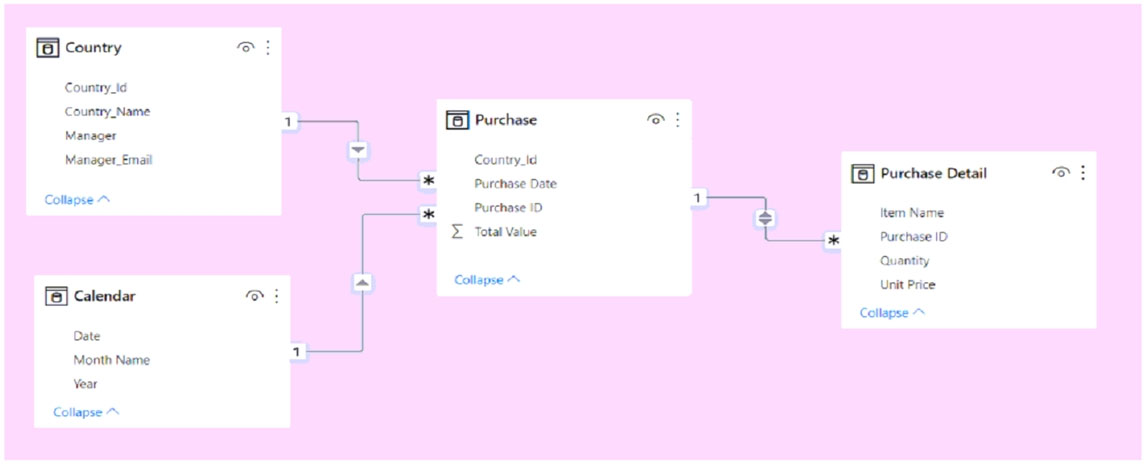
You have the Power BI model shown in the following exhibit.
A manager can represent only a single country.
You need to use row-level security (RLS) to meet the following requirements:
✑ The managers must only see the data of their respective country.
✑ The number of RLS roles must be minimized.
Which two actions should you perform? Each correct answer presents a complete solution.
NOTE: Each correct selection is worth one point.A. Create a single role that filters Country[Manager_Email] by using the USERNAME DAX function.
B. Create a single role that filters Country[Manager_Email] by using the USEROBJECTID DAX function.
C. For the relationship between Purchase Detail and Purchase, select Apply security filter in both directions.
D. Create one role for each country.
E. For the relationship between Purchase and Purchase Detail, change the Cross filter direction to Single.
You have a CSV file that contains user complaints. The file contains a column named Logged. Logged contains the date and time each complaint occurred. The data in Logged is in the following format: 2018-12-31 at 08:59.
You need to be able to analyze the complaints by the logged date and use a built-in date hierarchy.
What should you do?A. Apply the Parse function from the Data transformations options to the Logged column.
B. Change the data type of the Logged column to Date.
C. Split the Logged column by using at as the delimiter.
D. Create a column by example that starts with 2018-12-31.
After you answer a question in this section, you will NOT be able to return to it. As a result, these questions will not appear in the review screen.
You are modeling data by using Microsoft Power BI. Part of the data model is a large Microsoft SQL Server table named Order that has more than 100 million records.
During the development process, you need to import a sample of the data from the Order table.
Solution: From Power Query Editor, you import the table and then add a filter step to the query.
Does this meet the goal?A. Yes
B. No
You need to create a visual that compares profit across 10 product categories fora selected quarter.
What is the best visual to use to achieve the goal?A. an area chart
B. a funnel chart
C. a clustered bar chart
D. a line chart
HOTSPOT

-

You have Power BI report that contains the fields shown in the following exhibit.


Use the drop-down menus to select the answer choice that completes each statement based on the information presented in the graphic.

NOTE: Each correct selection is worth one point.


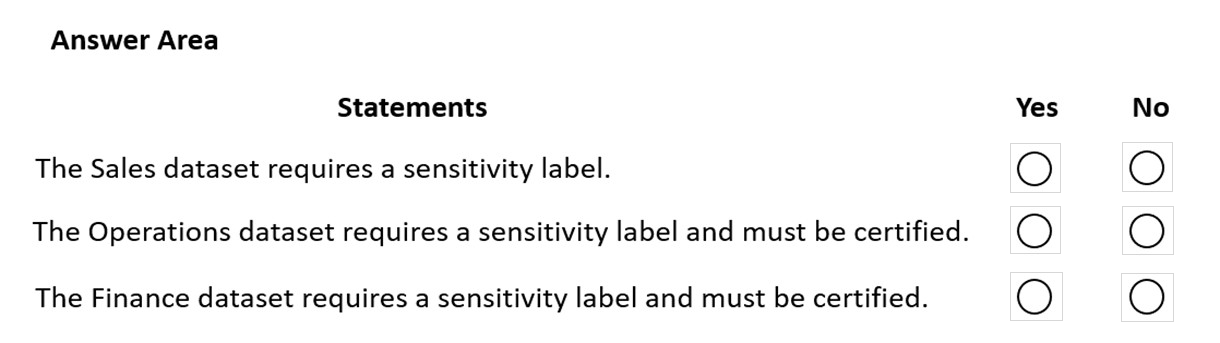
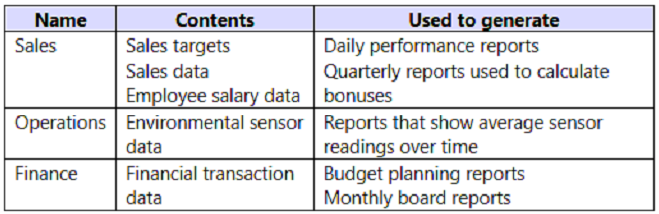
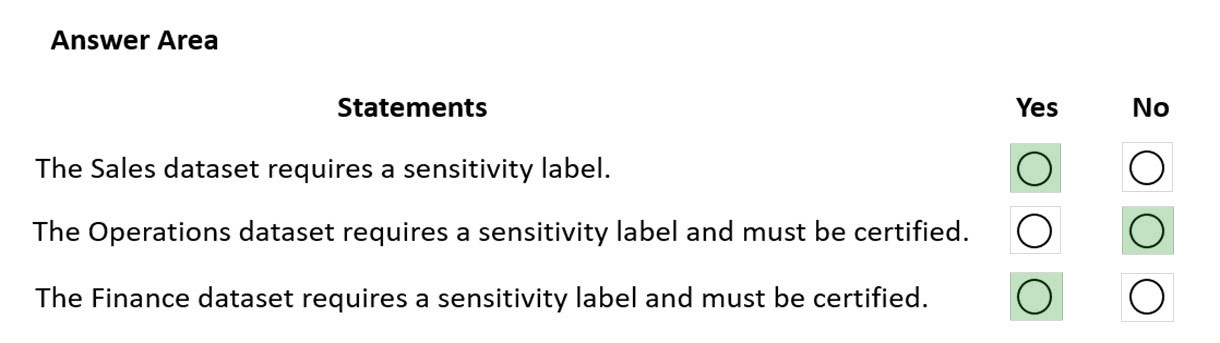
HOTSPOT -

You have a Power BI tenant that hosts the datasets shown in the following table.


You have the following requirements:

The export of reports that contain Personally Identifiable Information (PII) must be prevented.

Data used for financial decisions must be reviewed and approved before use.

For each of the following statements, select Yes if the statement is true. Otherwise, select No.

NOTE: Each correct selection is worth one point.

Hot Area:
DRAG DROP -
You are modifying a Power BI model by using Power BI Desktop.
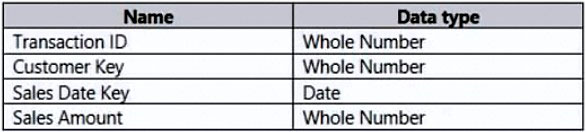
You have a table named Sales that contains the following fields.
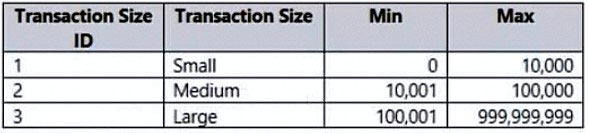
You have a table named Transaction Size that contains the following data.
You need to create a calculated column to classify each transaction as small, medium, or large based on the value in Sales Amount.
How should you complete the code? To answer, drag the appropriate values to the correct targets. Each value may be used once, more than once, or not at all.
You may need to drag the split bar between panes or scroll to view content.
NOTE: Each correct selection is worth one point.
Select and Place: