

PL-300 Practice Test Free – 50 Real Exam Questions to Boost Your Confidence
Preparing for the PL-300 exam? Start with our PL-300 Practice Test Free – a set of 50 high-quality, exam-style questions crafted to help you assess your knowledge and improve your chances of passing on the first try.
Taking a PL-300 practice test free is one of the smartest ways to:
- Get familiar with the real exam format and question types
- Evaluate your strengths and spot knowledge gaps
- Gain the confidence you need to succeed on exam day
Below, you will find 50 free PL-300 practice questions to help you prepare for the exam. These questions are designed to reflect the real exam structure and difficulty level. You can click on each Question to explore the details.
You have a Power BI report that uses row-level security (RLS).
You need to transfer RLS membership maintenance to an Azure network security team. The solution must NOT provide the Azure network security team with the ability to manage reports, datasets, or dashboards.
What should you do?
A. Grant the Read and Build permissions for the Power BI datasets to the Azure network security team.
B. Configure custom instructions for the Request access feature that instructs users to contact the Azure network security team.
C. Instruct the Azure network security team to create security groups. Configure RLS to use the groups.
D. Add the Azure network security team as members of the RLS role.
You have a Power BI dataset named Finance that is hosted in a Power BI workspace.
The finance team at your company is NOT currently a member of any Power BI workspace roles.
You need to enable the finance team to use Microsoft Excel to analyze the Finance dataset.
What should you do?
A. Grant the finance team build permissions to the Finance dataset.
B. Provide an Excel workbook that is connected to the Finance dataset.
C. Create a row-level security (RLS) role and add the finance team to the role as members.
D. Grant the finance team write permissions to the Finance dataset.
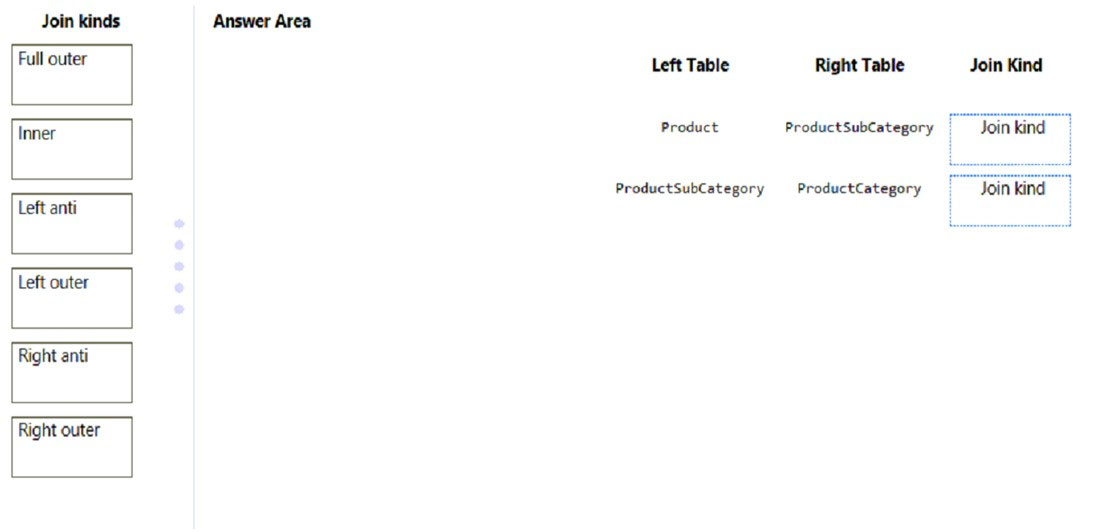
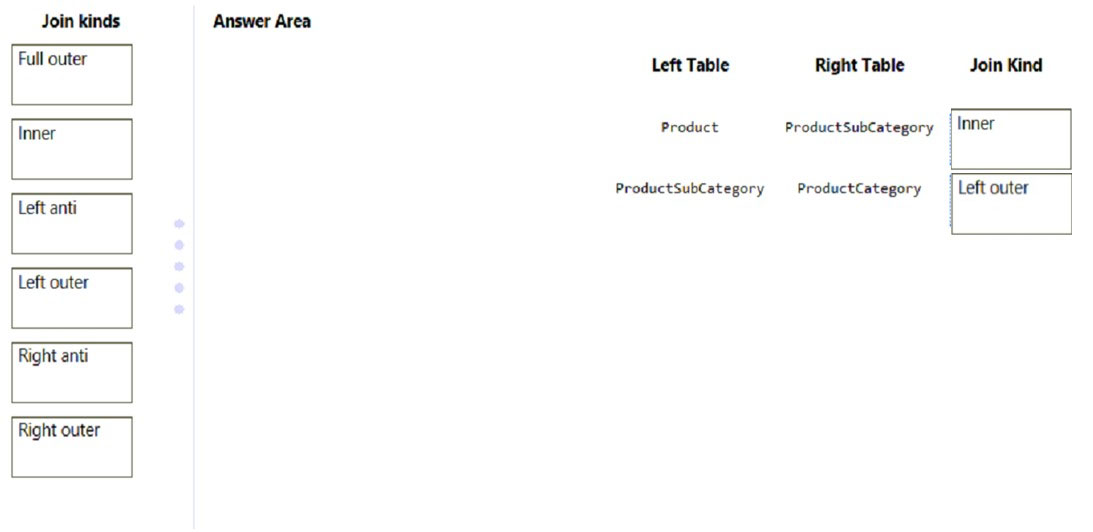
DRAG DROP -
In Power Query Editor, you have three queries named ProductCategory, ProductSubCategory, and Product.
Every Product has a ProductSubCategory.
Not every ProductsubCategory has a parent ProductCategory.
You need to merge the three queries into a single query. The solution must ensure the best performance in Power Query.
How should you merge the tables? To answer, drag the appropriate merge types to the correct queries. Each merge type may be used once, more than once, or not at all. You may need to drag the split bar between panes or scroll to view content.
NOTE: Each correct selection is worth one point.
Select and Place:
You need to configure access for the sales department users. The solution must the meet the security requirements.
What should you do?
A. Share each report to the Azure Active Directory group of the sales department.
B. Add the Azure Active Directory group of the sales department as an Admin of the reports workspace.
C. Distribute an app to the users in the Azure Active Directory group of the sales department.
D. Add the sales department as a member of the reports workspace.
DRAG DROP
-
You have two Microsoft Excel workbooks in a Microsoft OneDrive folder.
Each workbook contains a table named Sales. The tables have the same data structure in both workbooks.
You plan to use Power BI to combine both Sales tables into a single table and create visuals based on the data in the table. The solution must ensure that you can publish a separate report and dataset.
Which storage mode should you use for the report file and the dataset file? To answer, drag the appropriate modes to the correct files. Each mode may be used once, more than once, or not at all. You may need to drag the split bar between panes or scroll to view content.
NOTE: Each correct selection is worth one point.


You have a PBIX file that imports data from a Microsoft Excel data source stored in a file share on a local network.
You are notified that the Excel data source was moved to a new location.
You need to update the PBIX file to use the new location.
What are three ways to achieve the goal? Each correct answer presents a complete solution.
NOTE: Each correct selection is worth one point.
A. From the Datasets settings of the Power BI service, configure the data source credentials.
B. From the Data source settings in Power BI Desktop, configure the file path.
C. From Current File in Power BI Desktop, configure the Data Load settings.
D. From Power Query Editor, use the formula bar to configure the file path for the applied step.
E. From Advanced Editor in Power Query Editor, configure the file path in the M code.
You need to create the required relationship for the executive's visual.
What should you do before you can create the relationship?
A. Change the data type of Sales[region_id] to Whole Number.
B. Change the data type of Sales[region_id] to Decimal Number.
C. In the Sales table, add a measure for Sum(sales_amount).
D. Change the data type of Sales[sales_id] to Text.
From Power Query Editor, you attempt to execute a query and receive the following error message.
Datasource.Error: Could not find file.
What are two possible causes of the error? Each correct answer presents a complete solution.
NOTE: Each correct selection is worth one point.
A. You do not have permissions to the file.
B. An incorrect privacy level was used for the data source.
C. The file is locked.
D. The referenced file was moved to a new location.
Note: This question is part of a series of questions that present the same scenario. Each question in the series contains a unique solution that might meet the stated goals. Some question sets might have more than one correct solution, while others might not have a correct solution.
After you answer a question in this section, you will NOT be able to return to it. As a result, these questions will not appear in the review screen.
You are modeling data by using Microsoft Power BI. Part of the data model is a large Microsoft SQL Server table named Order that has more than 100 million records.
During the development process, you need to import a sample of the data from the Order table.
Solution: You write a DAX expression that uses the FILTER function.
Does this meet the goal?
A. Yes
B. No
DRAG DROP - You have the Power BI data model shown in the following exhibit.The Country table contains the following data.
You create two row-level security (RLS) roles named Manager and CFO. You plan to publish the dataset to the Power BI service. You need to create DAX expressions for the RLS filters. The solution must meet the following requirements: • Each manager must see only the data in the Sales and Human Resources tables for their own country. • The CFO must be prevented from seeing the data in the Human Resources table. • The CFO must see the sales data of all countries. How should you complete the DAX expressions to meet the requirements? To answer, drag the appropriate expressions to the correct targets. Each expression may be used once, more than once, or not at all. You may need to drag the split bar between panes or scroll to view content. NOTE: Each correct selection is worth one point.


Overview - Northwind Traders is a specialty food import company. The company recently implemented Power BI to better understand its top customers, products, and suppliers. Business Issues - The sales department relies on the IT department to generate reports in Microsoft SQL Server Reporting Services (SSRS). The IT department takes too long to generate the reports and often misunderstands the report requirements. Existing Environment. Data Sources Northwind Traders uses the data sources shown in the following table.Source2 is exported daily from a third-party system and stored in Microsoft SharePoint Online. Existing Environment. Customer Worksheet Source2 contains a single worksheet named Customer Details. The first 11 rows of the worksheet are shown in the following table.
All the fields in Source2 are mandatory. The Address column in Customer Details is the billing address, which can differ from the shipping address. Existing Environment. Azure SQL Database Source1 contains the following tables: Orders Products Suppliers Categories Order Details Sales Employees The Orders table contains the following columns.
The Order Details table contains the following columns.
The address in the Orders table is the shipping address, which can differ from the billing address. The Products table contains the following columns.
The Categories table contains the following columns.
The Suppliers table contains the following columns.
The Sales Employees table contains the following columns.
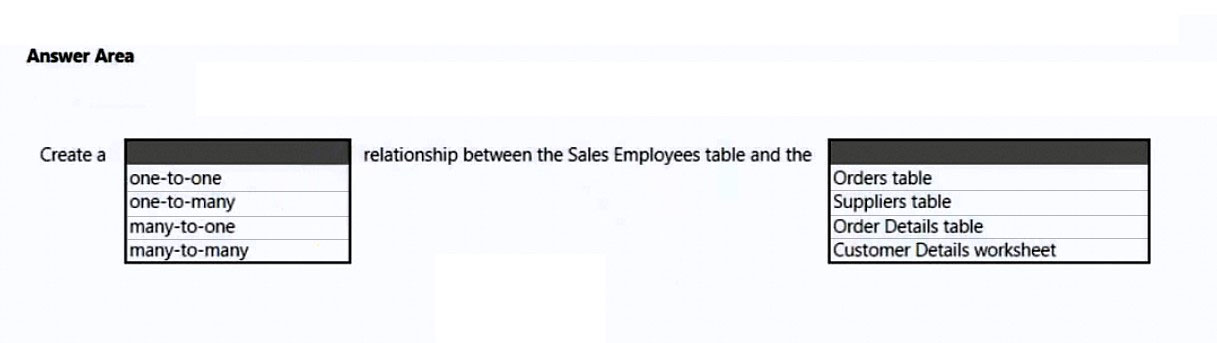
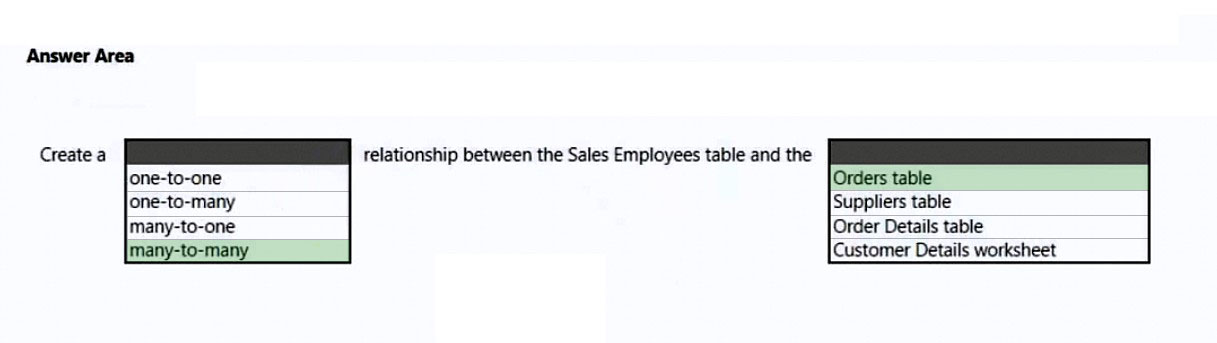
Each employee in the Sales Employees table is assigned to one sales region. Multiple employees can be assigned to each region. Requirements. Report Requirements Northwind Traders requires the following reports: Top Products Top Customers On-Time Shipping The Top Customers report will show the top 20 customers based on the highest sales amounts in a selected order month or quarter, product category, and sales region. The Top Products report will show the top 20 products based on the highest sales amounts sold in a selected order month or quarter, sales region, and product category. The report must also show which suppliers provide the top products. The On-Time Shipping report will show the following metrics for a selected shipping month or quarter: The percentage of orders that were shipped late by country and shipping region Customers that had multiple late shipments during the last quarter Northwind Traders defines late orders as those shipped after the required shipping date. The warehouse shipping department must be notified if the percentage of late orders within the current month exceeds 5%. The reports must show historical data for the current calendar year and the last three calendar years. Requirements. Technical Requirements Northwind Traders identifies the following technical requirements: A single dataset must support all three reports. The reports must be stored in a single Power BI workspace. Report data must be current as of 7 AM Pacific Time each day. The reports must provide fast response times when users interact with a visualization. The data model must minimize the size of the dataset as much as possible, while meeting the report requirements and the technical requirements. Requirements. Security Requirements Access to the reports must be granted to Azure Active Directory (Azure AD) security groups only. An Azure AD security group exists for each department. The sales department must be able to perform the following tasks in Power BI: Create, edit, and delete content in the reports. Manage permissions for workspaces, datasets, and reports. Publish, unpublish, update, and change the permissions for an app. Assign Azure AD groups role-based access to the reports workspace. Users in the sales department must be able to access only the data of the sales region to which they are assigned in the Sales Employees table. Power BI has the following row-level security (RLS) Table filter DAX expression for the Sales Employees table. [EmailAddress] = USERNAME() RLS will be applied only to the sales department users. Users in all other departments must be able to view all the data. HOTSPOT - You need to create a relationship in the dataset for RLS. What should you do? To answer, select the appropriate options in the answer area. NOTE: Each correct selection is worth one point. Hot Area:
You maintain a Power BI workspace that contains a supplier quality dashboard. The dashboard contains 10 card visuals, two map visuals and five bar chart visuals. The dashboard mobile layout is shown in the exhibit. (Click the Exhibit tab.)You need to modify the dashboard mobile layout to meet the following requirements: ✑ Only show single-value visuals. ✑ Minimize scrolling. What should you do?
A. Decrease the size of the card visuals. Remove the map and bar chart visuals.
B. Decrease the size of the map and bar chart visuals. Move all the card visuals to the top of the layout.
C. Remove the card visuals. Increase the size of the map and bar chart visuals.
D. Move the bar chart visuals to the top of the layout. Remove the map visuals. Decrease the size of the card visuals.
HOTSPOT
-
You have a query named All Sales that imports sales data into a Power BI model.
You plan to create a star schema by separating columns into separate queries and performing further transformations. The solution must meet the following requirements:
•	Use All Sales as the source for three other queries named Sales Fact, Product Dimension, and Customer Dimension.
•	Minimize maintenance effort.
What should you do to create the Sales Fact query, and for which query should you clear Enable load? To answer, select the appropriate options in the answer area.
NOTE: Each correct selection is worth one point.


Overview - Northwind Traders is a specialty food import company. The company recently implemented Power BI to better understand its top customers, products, and suppliers. Business Issues - The sales department relies on the IT department to generate reports in Microsoft SQL Server Reporting Services (SSRS). The IT department takes too long to generate the reports and often misunderstands the report requirements. Existing Environment. Data Sources Northwind Traders uses the data sources shown in the following table.
A. Group the Categories table by the CategoryID column.
B. Remove the QuantityPerUnit column from the Products table.
C. Filter out discontinued products while importing the Products table.
D. Change the OrderID column in the Orders table to the Text data type.
You have a Microsoft Power BI report. The size of PBIX file is 550 MB. The report is accessed by using an App workspace in shared capacity of powerbi.com.
The report uses an imported dataset that contains one fact table. The fact table contains 12 million rows. The dataset is scheduled to refresh twice a day at 08:00 and 17:00.
The report is a single page that contains 15 AppSource visuals and 10 default visuals.
Users say that the report is slow to load the visuals when they access and interact with the report.
You need to recommend a solution to improve the performance of the report.
What should you recommend?
A. Replace the default visuals with AppSource visuals.
B. Remove unused columns from tables in the data model.
C. Change the imported dataset to DirectQuery
D. Increase the number of times that the dataset is refreshed.
Overview - Litware, Inc. is an online retailer that uses Power BI. Litware plans to leverage data from an Azure SQL database that stores data for the company's live e-commerce website. Litware uses Azure Active Directory (Azure AD) to authenticate users. Existing Environment. Sales Data Litware has online sales data that has the SQL schema shown in the following table.In the Date table, the date_id column has a format of yyyymmdd and the month column has a format of yyyymm. The week column in the Date table and the week_id column in the Weekly_Returns table have a format of yyyyww. In the Sales table, the sales_id column represents a unique transaction. The region id column can be managed by only one sales manager. Existing Environment. Data Concerns You are concerned with the quality and completeness of the sales data. You must ensure that negative and missing sales_amount values do NOT contribute to the total sales amount calculation. Existing Environment. Reporting Requirements Litware identifies the following reporting requirements: Executives require a visual that shows sales by region. Executives require a visual that shows returns by region manager and the sales managers that report to them. The sales managers must be able to see only the sales data of their respective region. The sales managers require a visual to analyze sales performance versus sales targets. The sales department requires reports that contain the number of sales transactions. Users must be able to see the month in each report as shown in the following example: Feb 2020. The customer service department requires a visual that can be filtered by both sales month and ship month independently. The maximum allowed latency to include transactions in reports is five minutes. You need to create relationships to meet the reporting requirements of the customer service department. What should you create?
A. a one-to-many relationship from Date[date_id] to Sales[sales_date_id] and another one-to-many relationship from Date[date_id] to Weekly_Returns[week_id]
B. a one-to-many relationship from Sales[sales_date_id] to Date[date_id] and a one-to-many relationship from Sales[sales_ship_date_id] to Date[date_id]
C. an additional date table named ShipDate, a many-to-many relationship from Sales[sales_date_id] to Date[date_id], and a many-to-many relationship from Sales[sales_ship_date_id] to ShipDate[date_id]
D. an additional date table named ShipDate, a one-to-many relationship from Date[date_id] to Sales[sales_date_id], and a one-to-many relationship from ShipDate[date_id] to Sales[sales_skip_date_id]
Overview - Litware, Inc. is an online retailer that uses Power BI. Litware plans to leverage data from an Azure SQL database that stores data for the company's live e-commerce website. Litware uses Azure Active Directory (Azure AD) to authenticate users. Existing Environment. Sales Data Litware has online sales data that has the SQL schema shown in the following table.In the Date table, the date_id column has a format of yyyymmdd and the month column has a format of yyyymm. The week column in the Date table and the week_id column in the Weekly_Returns table have a format of yyyyww. In the Sales table, the sales_id column represents a unique transaction. The region id column can be managed by only one sales manager. Existing Environment. Data Concerns You are concerned with the quality and completeness of the sales data. You must ensure that negative and missing sales_amount values do NOT contribute to the total sales amount calculation. Existing Environment. Reporting Requirements Litware identifies the following reporting requirements: Executives require a visual that shows sales by region. Executives require a visual that shows returns by region manager and the sales managers that report to them. The sales managers must be able to see only the sales data of their respective region. The sales managers require a visual to analyze sales performance versus sales targets. The sales department requires reports that contain the number of sales transactions. Users must be able to see the month in each report as shown in the following example: Feb 2020. The customer service department requires a visual that can be filtered by both sales month and ship month independently. The maximum allowed latency to include transactions in reports is five minutes. You need to get data from the Microsoft SQL Server tables. What should you use to configure the connection?
A. Import that uses a Microsoft account
B. Import that uses a database credential
C. DirectQuery that uses a database credential
D. DirectQuery that uses the end-user’s credentials
You have a dataset that is used infrequently and refreshes every hour.
You receive a notification that the refresh was disabled due to inactivity.
Which two actions will cause the scheduled refresh schedule to resume? Each correct answer presents a complete solution.
NOTE: Each correct selection is worth one point.
A. Enable query caching for the dataset.
B. Import the dataset to Microsoft Excel.
C. From the Power BI service, open a dashboard that uses the dataset.
D. From the Power BI service, open a report that uses the dataset.
E. From PowerShell, run the get-powerbireport cmdlet.
You have a Power BI workspace named Workspace1 that contains a dataset named DS1 and a report named RPT1.
A user wants to create a report by using the data in DS1 and publish the report to another workspace.
You need to provide the user with the appropriate access. The solution must minimize the number of access permissions granted to the user.
What should you do?
A. Add the user as a Viewer of Workspace1.
B. Grant the Build permission for DS1 to the user.
C. Share RPT1 with the user.
D. Add the user as a member of Workspace1.
You plan to use Power BI to create sales invoices for customers. The solution must meet the following requirements:
• Sales invoices must be exported in a PDF format.
• The PDF exports must show all columns and rows clearly.
What should you create?
A. a paginated report that contains a tablix
B. a dashboard that contains a table
C. an interactive report that contains a table
D. an interactive report that contains a matrix
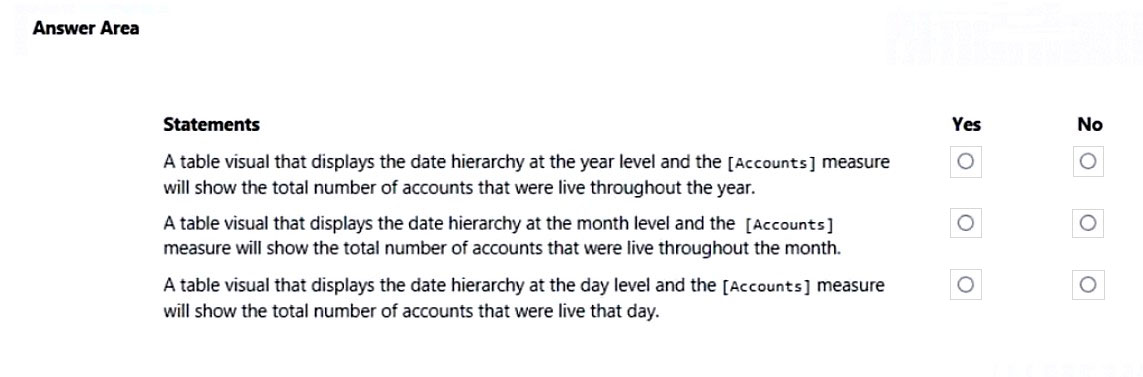
HOTSPOT - You have a Power BI report. You have the following tables.You have the following DAX measure. Accounts := CALCULATE ( DISTINCTCOUNT (Balances[AccountID]), LASTDATE ('Date'[Date]) For each of the following statements, select Yes if the statement is true. Otherwise, select No. NOTE: Each correct selection is worth one point. Hot Area:

You import two Microsoft Excel tables named Customer and Address into Power Query. Customer contains the following columns:
✑ Customer ID
✑ Customer Name
✑ Phone
✑ Email Address
✑ Address ID
Address contains the following columns:
✑ Address ID
✑ Address Line 1
✑ Address Line 2
✑ City
✑ State/Region
✑ Country
✑ Postal Code
Each Customer ID represents a unique customer in the Customer table. Each Address ID represents a unique address in the Address table.
You need to create a query that has one row per customer. Each row must contain City, State/Region, and Country for each customer.
What should you do?
A. Merge the Customer and Address tables.
B. Group the Customer and Address tables by the Address ID column.
C. Transpose the Customer and Address tables.
D. Append the Customer and Address tables.

You have a Microsoft Power BI report. The size of PBIX file is 550 MB. The report is accessed by using an App workspace in shared capacity of powerbi.com.
The report uses an imported dataset that contains one fact table. The fact table contains 12 million rows. The dataset is scheduled to refresh twice a day at 08:00 and 17:00.
The report is a single page that contains 15 AppSource visuals and 10 default visuals.
Users say that the report is slow to load the visuals when they access and interact with the report.
You need to recommend a solution to improve the performance of the report.
What should you recommend?
A. Enable visual interactions.
B. Change any DAX measures to use iterator functions.
C. Implement row-level security (RLS).
D. Remove unused columns from tables in the data model.
You have a PBIX file that imports data from a Microsoft Excel data source stored in a file share on a local network.
You are notified that the Excel data source was moved to a new location.
You need to update the PBIX file to use the new location.
What are three ways to achieve the goal? Each correct answer presents a complete solution.
NOTE: Each correct selection is worth one point.
A. From the Datasets settings of the Power BI service, configure the data source credentials.
B. From the Data source settings in Power BI Desktop, configure the file path.
C. From Current File in Power BI Desktop, configure the Data Load settings.
D. From Power Query Editor, use the formula bar to configure the file path for the applied step.
E. From Advanced Editor in Power Query Editor, configure the file path in the M code.
HOTSPOT - You have the Power BI data model shown in the following exhibit.The Sales table has the following columns.
The data model must support the following analysis: • Total sales by product by month in which the order was placed • Quantities sold by product by day on which the order was placed • Number of sales transactions by quarter in which the order was placed For each of the following statements, select Yes if the statement is true. Otherwise, select No. NOTE: Each correct selection is worth one point.


You have a Power BI report that will be rendered on a vertical display.
You need to maximize the portion of the screen area used by the report.
What should you do?
A. From the Canvas background setting of Power BI Desktop, configure the Image fit setting.
B. From the Canvas settings of Power BI Desktop, set a custom width and height.
C. From Power BI Desktop, select Personalize visuals.
D. From the Power BI service, enable the Pages pane.
You are using the key influencers visual to identify which factors affect the quantity of items sold in an order. You add the following fields to the Explain By field: ✑ Customer Country ✑ Product Category ✑ Supplier Country ✑ Sales Employee ✑ Supplier Name ✑ Product Name ✑ Customer City The key influencers visual returns the results shown in the following exhibit.What can you identify from the visual?
A. Customers in Austria order 18.8 more units than the average order quantity.
B. Customers in Boise order 20.37 percent more than the average order quantity.
C. Product Category positively influences the quantity per order.
D. Customers in Cork order lower quantities than average.
HOTSPOT - You are using Power Query Editor to preview the data in a column named Max Temp. The column statistics and value distribution are shown in the following exhibit.Use the drop-down menus to select the answer choice that completes each statement based on the information presented in the graphic. NOTE: Each correct selection is worth one point.


Overview - Northwind Traders is a specialty food import company. The company recently implemented Power BI to better understand its top customers, products, and suppliers. Business Issues - The sales department relies on the IT department to generate reports in Microsoft SQL Server Reporting Services (SSRS). The IT department takes too long to generate the reports and often misunderstands the report requirements. Existing Environment. Data Sources Northwind Traders uses the data sources shown in the following table.Source2 is exported daily from a third-party system and stored in Microsoft SharePoint Online. Existing Environment. Customer Worksheet Source2 contains a single worksheet named Customer Details. The first 11 rows of the worksheet are shown in the following table.
All the fields in Source2 are mandatory. The Address column in Customer Details is the billing address, which can differ from the shipping address. Existing Environment. Azure SQL Database Source1 contains the following tables: Orders Products Suppliers Categories Order Details Sales Employees The Orders table contains the following columns.
The Order Details table contains the following columns.
The address in the Orders table is the shipping address, which can differ from the billing address. The Products table contains the following columns.
The Categories table contains the following columns.
The Suppliers table contains the following columns.
The Sales Employees table contains the following columns.
Each employee in the Sales Employees table is assigned to one sales region. Multiple employees can be assigned to each region. Requirements. Report Requirements Northwind Traders requires the following reports: Top Products Top Customers On-Time Shipping The Top Customers report will show the top 20 customers based on the highest sales amounts in a selected order month or quarter, product category, and sales region. The Top Products report will show the top 20 products based on the highest sales amounts sold in a selected order month or quarter, sales region, and product category. The report must also show which suppliers provide the top products. The On-Time Shipping report will show the following metrics for a selected shipping month or quarter: The percentage of orders that were shipped late by country and shipping region Customers that had multiple late shipments during the last quarter Northwind Traders defines late orders as those shipped after the required shipping date. The warehouse shipping department must be notified if the percentage of late orders within the current month exceeds 5%. The reports must show historical data for the current calendar year and the last three calendar years. Requirements. Technical Requirements Northwind Traders identifies the following technical requirements: A single dataset must support all three reports. The reports must be stored in a single Power BI workspace. Report data must be current as of 7 AM Pacific Time each day. The reports must provide fast response times when users interact with a visualization. The data model must minimize the size of the dataset as much as possible, while meeting the report requirements and the technical requirements. Requirements. Security Requirements Access to the reports must be granted to Azure Active Directory (Azure AD) security groups only. An Azure AD security group exists for each department. The sales department must be able to perform the following tasks in Power BI: Create, edit, and delete content in the reports. Manage permissions for workspaces, datasets, and reports. Publish, unpublish, update, and change the permissions for an app. Assign Azure AD groups role-based access to the reports workspace. Users in the sales department must be able to access only the data of the sales region to which they are assigned in the Sales Employees table. Power BI has the following row-level security (RLS) Table filter DAX expression for the Sales Employees table. [EmailAddress] = USERNAME() RLS will be applied only to the sales department users. Users in all other departments must be able to view all the data. You need to create the dataset. Which dataset mode should you use?
A. Import
B. DirectQuery
C. Composite
D. live connection
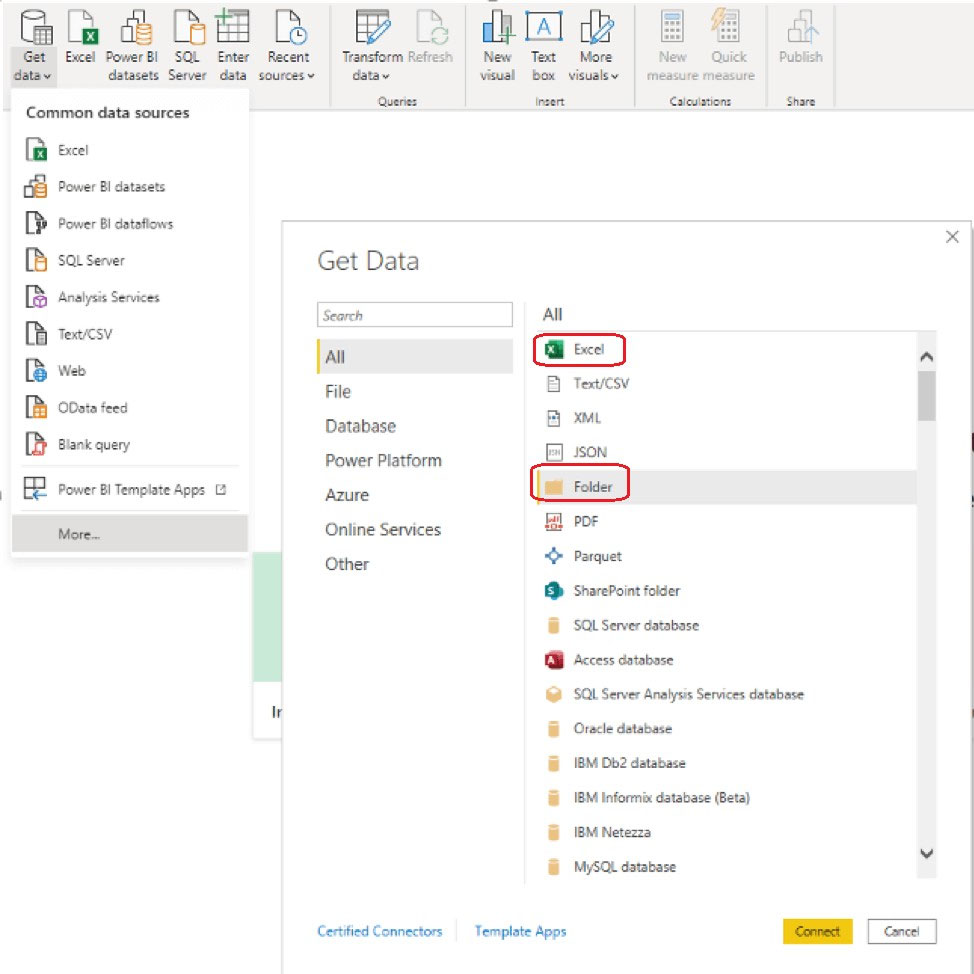
You have a Microsoft Excel file in a Microsoft OneDrive folder.
The file must be imported to a Power BI dataset.
You need to ensure that the dataset can be refreshed in powerbi.com.
Which two connectors can you use to connect to the file? Each correct answer presents a complete solution.
NOTE: Each correct selection is worth one point.
A. Excel Workbook
B. Text/CSV
C. Folder
D. SharePoint folder
E. Web
DRAG DROP
-
You have two Microsoft Excel workbooks in a Microsoft OneDrive folder.
Each workbook contains a table named Sales. The tables have the same data structure in both workbooks.
You plan to use Power BI to combine both Sales tables into a single table and create visuals based on the data in the table. The solution must ensure that you can publish a separate report and dataset.
Which storage mode should you use for the report file and the dataset file? To answer, drag the appropriate modes to the correct files. Each mode may be used once, more than once, or not at all. You may need to drag the split bar between panes or scroll to view content.
NOTE: Each correct selection is worth one point.
You have a CSV file that contains user complaints. The file contains a column named Logged. Logged contains the date and time each complaint occurred. The data in Logged is in the following format: 2018-12-31 at 08:59.
You need to be able to analyze the complaints by the logged date and use a built-in date hierarchy.
What should you do?
A. Create a column by example that starts with 2018-12-31 and set the data type of the new column to Date
B. Create a column by example that starts with 2018-12-31
C. Apply a transformation to extract the last 11 characters of the Logged column
D. Add a conditional column that outputs 2018 if the Logged column starts with 2018 and set the data type of the new column to Whole Number
HOTSPOT - You are creating an analytics report that will consume data from the tables shown in the following table.There is a relationship between the tables. There are no reporting requirements on employee_id and employee_photo. You need to optimize the data model. What should you configure for employee_id and employee_photo? To answer, select the appropriate options in the answer area. NOTE: Each correct selection is worth one point. Hot Area:


HOTSPOT -
You are building a financial report by using Power BI.
You have a table named financials that contains a column named Date and a column named Sales.
You need to create a measure that calculates the relative change in sales as compared to the previous quarter.
How should you complete the measure? To answer, select the appropriate options in the answer area.
NOTE: Each correct selection is worth one point.
Hot Area:


You have a Power BI model that contains a table named Sales. The Sales table contains the following columns:
•	Order Line ID
•	Product ID
•	Unit Price
•	Order ID
•	Quantity
Orders are uniquely identified by using the order ID and can have multiple order lines. Each order line within an order contains a different product ID.
You need to write a DAX measure that counts the number of orders.
Which formula should you use?
A. Count(‘Sales'[Order ID])
B. CountA(‘Sales’ [Order ID])
C. CountRows(‘Sales’)
D. DistinctCount(‘Sales’ [Order ID])
Overview - Litware, Inc. is an online retailer that uses Power BI. Litware plans to leverage data from an Azure SQL database that stores data for the company's live e-commerce website. Litware uses Azure Active Directory (Azure AD) to authenticate users. Existing Environment. Sales Data Litware has online sales data that has the SQL schema shown in the following table.
A. FORMAT(‘Date'[date],”MMM YYYY”)
B. FORMAT(‘Date'[date_id],”MMM”) & ” ” & FORMAT(‘Date'[year], “#”)
C. FORMAT(‘Date'[date_id],”MMM YYYY”)
D. FORMAT(‘Date'[date],”M YY”)
You have a Microsoft Power BI report. The size of PBIX file is 550 MB. The report is accessed by using an App workspace in shared capacity of powerbi.com.
The report uses an imported dataset that contains one fact table. The fact table contains 12 million rows. The dataset is scheduled to refresh twice a day at 08:00 and 17:00.
The report is a single page that contains 15 AppSource visuals and 10 default visuals.
Users say that the report is slow to load the visuals when they access and interact with the report.
You need to recommend a solution to improve the performance of the report.
What should you recommend?
A. Change any DAX measures to use iterator functions.
B. Remove unused columns from tables in the data model.
C. Replace the default visuals with AppSource visuals.
D. Increase the number of times that the dataset is refreshed.
You have a CSV file that contains user complaints. The file contains a column named Logged. Logged contains the date and time each complaint occurred. The data in Logged is in the following format: 2018-12-31 at 08:59.
You need to be able to analyze the complaints by the logged date and use a built-in date hierarchy.
What should you do?
A. Apply the Parse function from the Data transformations options to the Logged column.
B. Change the data type of the Logged column to Date.
C. Split the Logged column by using at as the delimiter.
D. Create a column by example that starts with 2018-12-31.
HOTSPOT
-
You have a query named All Sales that imports sales data into a Power BI model.
You plan to create a star schema by separating columns into separate queries and performing further transformations. The solution must meet the following requirements:
• Use All Sales as the source for three other queries named Sales Fact, Product Dimension, and Customer Dimension.
• Minimize maintenance effort.
What should you do to create the Sales Fact query, and for which query should you clear Enable load? To answer, select the appropriate options in the answer area.
NOTE: Each correct selection is worth one point.
HOTSPOT - You have the Power BI data model shown in the following exhibit.You need to create a measure to count the number of product categories that had products sold during a selected period. How should you complete the DAX expression? To answer, select the appropriate options in the answer area. NOTE: Each correct selection is worth one point.


You have a Power BI report that contains three pages named Page1, Page2, and Page3. All the pages have the same slicers.
You need to ensure that all the filters applied to Page1 apply to Page1 and Page3 only.
What should you do?
A. On each page, modify the interactions of the slicer.
B. Enable visibility of the slicers on Page1 and Page3. Disable visibility of the slicer on Page2.
C. Sync the slicers on Page1 and Page3.
You build a Power BI report that displays IoT temperature data streaming from a refrigerator.
You publish the report to the Power BI service.
You need to be notified when the temperature rises above four degrees Celsius.
What should you do?
A. Set an alert on a KPI visual in the report.
B. Pin a card visual to a dashboard and create a subscription.
C. Pin a card visual to a dashboard and set an alert on the tile.
D. Pin a report page to a dashboard and set an alert on the page.
After you answer a question in this section, you will NOT be able to return to it. As a result, these questions will not appear in the review screen.
You have a Power BI report that imports a date table and a sales table from an Azure SQL database data source. The sales table has the following date foreign keys:
✑ Due Date
✑ Order Date
✑ Delivery Date
You need to support the analysis of sales over time based on all the date foreign keys.
Solution: For each date foreign key, you add inactive relationships between the sales table and the date table.
Does this meet the goal?
A. Yes
B. No
You have a CSV file that contains user complaints. The file contains a column named Logged. Logged contains the date and time each complaint occurred. The data in Logged is in the following format: 2018-12-31 at 08:59.
You need to be able to analyze the complaints by the logged date and use a built-in date hierarchy.
What should you do?
A. Apply a transformation to extract the last 11 characters of the Logged column and set the data type of the new column to Date.
B. Change the data type of the Logged column to Date.
C. Split the Logged column by using at as the delimiter.
D. Apply the Parse function from the Date transformations options to the Logged column.
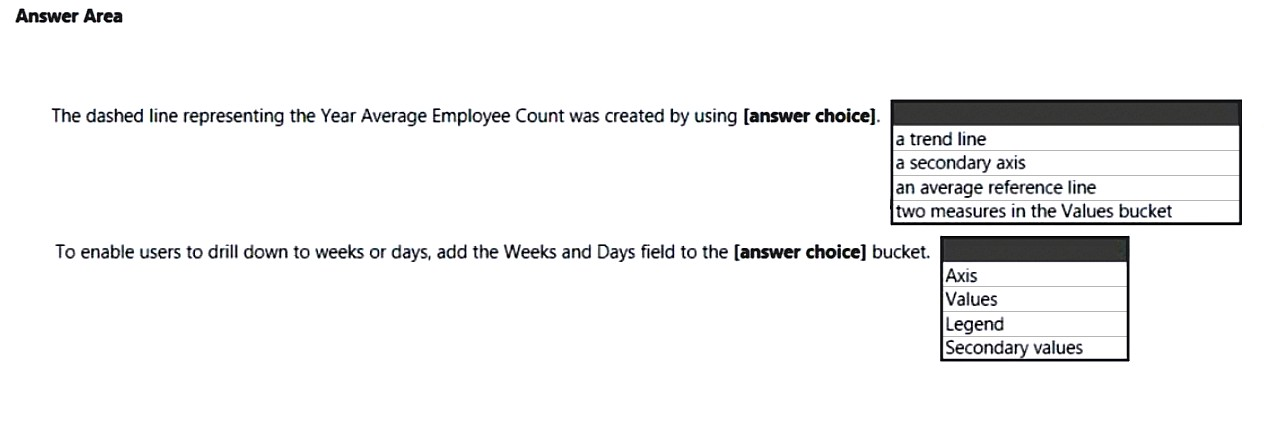
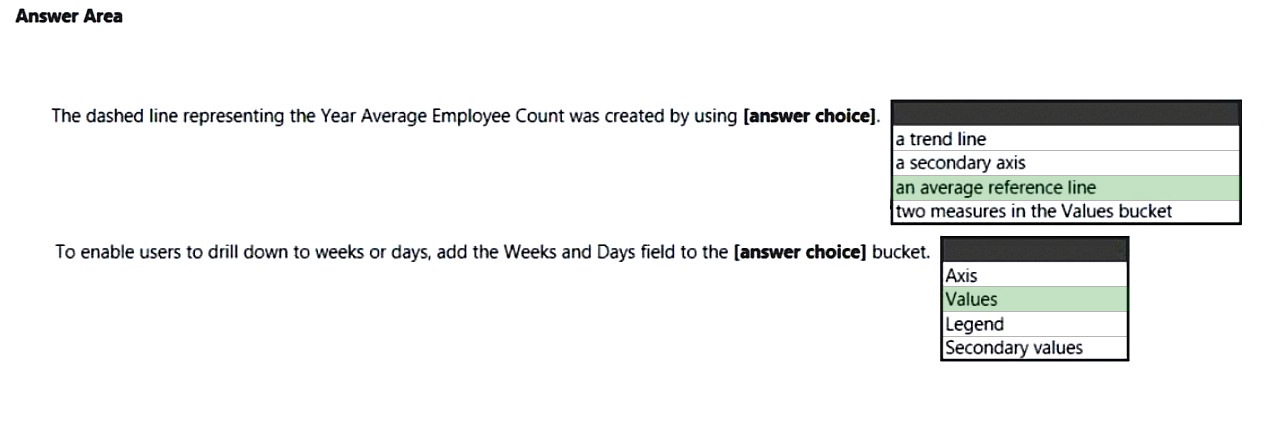
HOTSPOT - You are creating a line chart in a Power BI report as shown in the following exhibit.Use the drop-down menus to select the answer choice that completes each statement based on the information presented in the graphic. NOTE: Each correct selection is worth one point. Hot Area:
You have a Power BI report that uses row-level security (RLS).
You need to transfer RLS membership maintenance to an Azure network security team. The solution must NOT provide the Azure network security team with the ability to manage reports, datasets, or dashboards.
What should you do?
A. Grant the Read and Build permissions for the Power BI datasets to the Azure network security team.
B. Configure custom instructions for the Request access feature that instructs users to contact the Azure network security team.
C. Instruct the Azure network security team to create security groups. Configure RLS to use the groups.
D. Add the Azure network security team as members of the RLS role.
You use Power BI Desktop to load data from a Microsoft SQL Server database. While waiting for the data to load, you receive the following error.You need to resolve the error. What are two ways to achieve the goal? Each correct answer presents a complete solution. NOTE: Each correct selection is worth one point.
A. Reduce the number of rows and columns returned by each query.
B. Split log running queries into subsets of columns and use Power Query to merge the queries.
C. Use Power Query to combine log running queries into one query.
D. Disable query folding on long running queries.
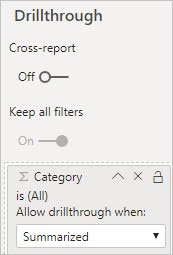
HOTSPOT
-
You have a Power BI report that contains a page. The page contains the following visuals:
•	A card
•	A matrix
•	A bar chart
You need to configure the page to ensure that the card and the bar chart are unaffected when a user drills down in the matrix. The card and the bar chart must change when a user selects a cell in the matrix.
What should you configure? To answer, select the appropriate options in the answer area.
NOTE: Each correct selection is worth one point.


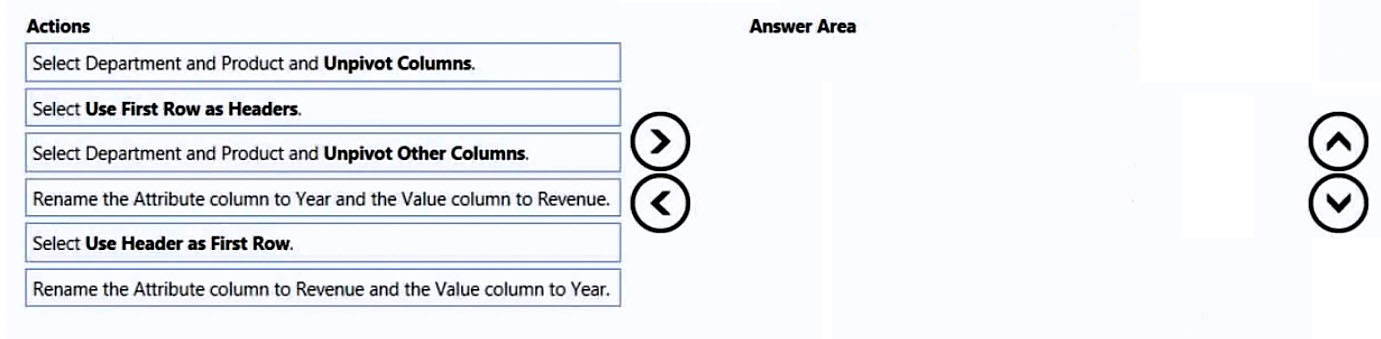
DRAG DROP - You receive revenue data that must be included in Microsoft Power BI reports. You preview the data from a Microsoft Excel source in Power Query as shown in the following exhibit.You plan to create several visuals from the data, including a visual that shows revenue split by year and product. You need to transform the data to ensure that you can build the visuals. The solution must ensure that the columns are named appropriately for the data that they contain. Which three actions should you perform in sequence? To answer, move the appropriate actions from the list of actions to the answer area and arrange them in the correct order. Select and Place:

You have a CSV file that contains user complaints. The file contains a column named Logged. Logged contains the date and time each complaint occurred. The data in Logged is in the following format: 2018-12-31 at 08:59.
You need to be able to analyze the complaints by the logged date and use a built-in date hierarchy.
What should you do?
A. Create a column by example that starts with 2018-12-31 and set the data type of the new column to Date
B. Create a column by example that starts with 2018-12-31
C. Apply a transformation to extract the last 11 characters of the Logged column
D. Add a conditional column that outputs 2018 if the Logged column starts with 2018 and set the data type of the new column to Whole Number
Free Access Full PL-300 Practice Test Free Questions
If you’re looking for more PL-300 practice test free questions, click here to access the full PL-300 practice test.
We regularly update this page with new practice questions, so be sure to check back frequently.
Good luck with your PL-300 certification journey!