vSphere Resource Monitoring Tools
Learner Objectives
After completing this lesson, you should be able to meet the following objectives:
- Describe the performance-tuning methodology
- Identify resource-monitoring tools
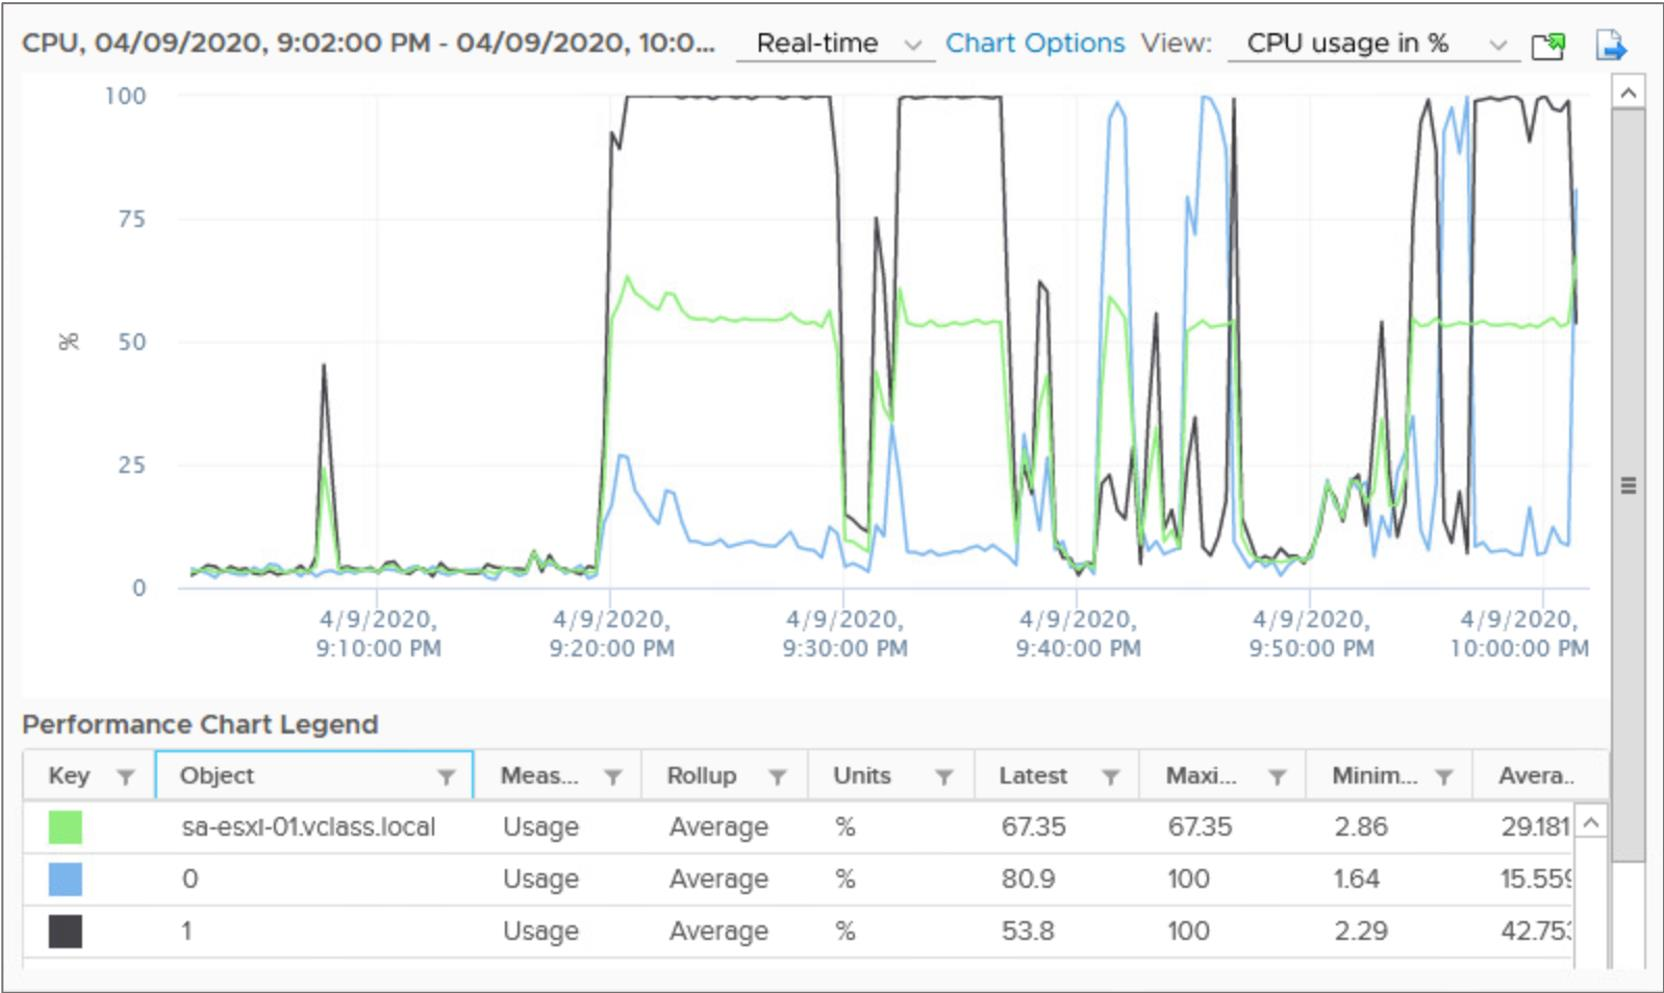
- Use vCenter Server performance charts to view performance
Performance-Tuning Methodology

You can tune the performance of your vSphere environment:
- Assess performance:
- Use appropriate monitoring tools.
- Record a numerical benchmark before changes.
- Identify the limiting resource.
- Make more resources available: – Allocate more resources.
- Reduce competition. – Log your changes.
- Benchmark again.
Resource-Monitoring Tools
Many resource-monitoring and performance-monitoring tools are available for use with vSphere.
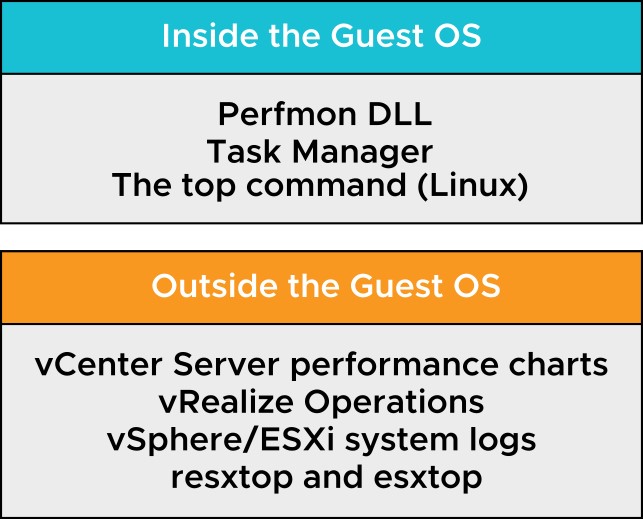
Guest Operating System Monitoring Tools
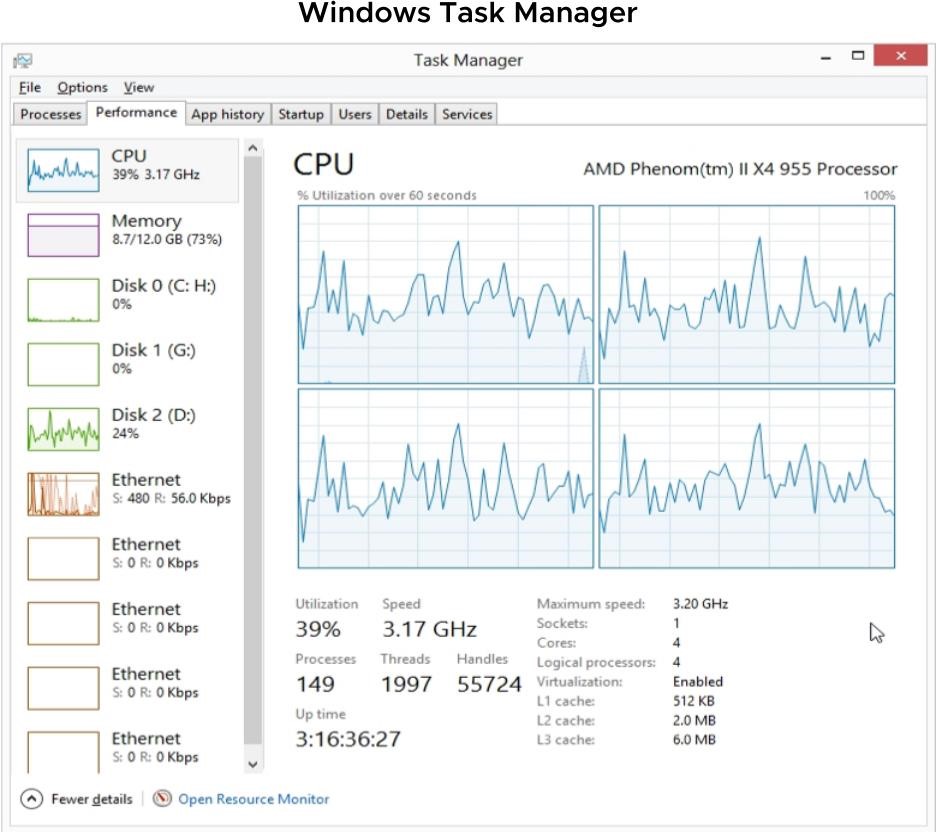
To monitor performance in the guest operating system, use tools that you are familiar with, such as Windows Task Manager.
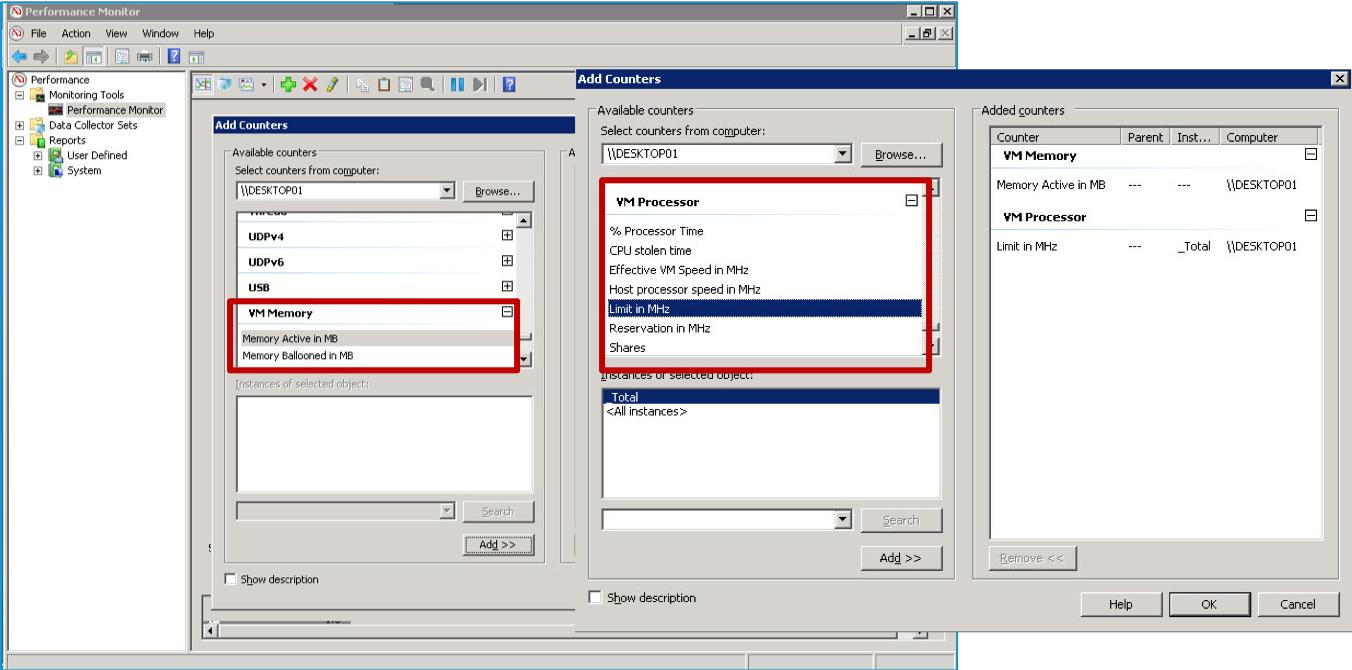
Using Perfmon to Monitor VM Resources
The Perfmon DLL in VMware Tools provides VM processor and memory objects for accessing host statistics in a VM.
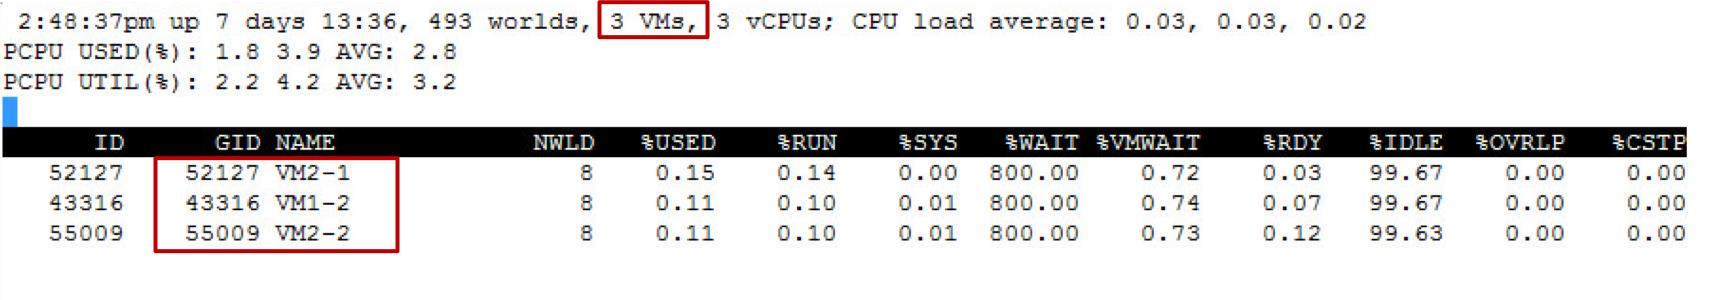
Using esxtop to Monitor VM Resources
The esxtop utility is the primary real-time performance monitoring tool for vSphere:
- Can be run from the host’s local vSphere ESXi Shell as esxtop
- Can be run remotely from vSphere CLI as resxtop
- Works like the top performance utility in Linux operating systems
In this example, you enter lowercase c and uppercase V to view CPU metrics for VMs.
Monitoring Inventory Objects with Performance Charts
The vSphere statistics subsystem collects data on the resource usage of inventory objects, which include:
- Clusters
- Hosts
- Datastores
- Networks
- Virtual machines
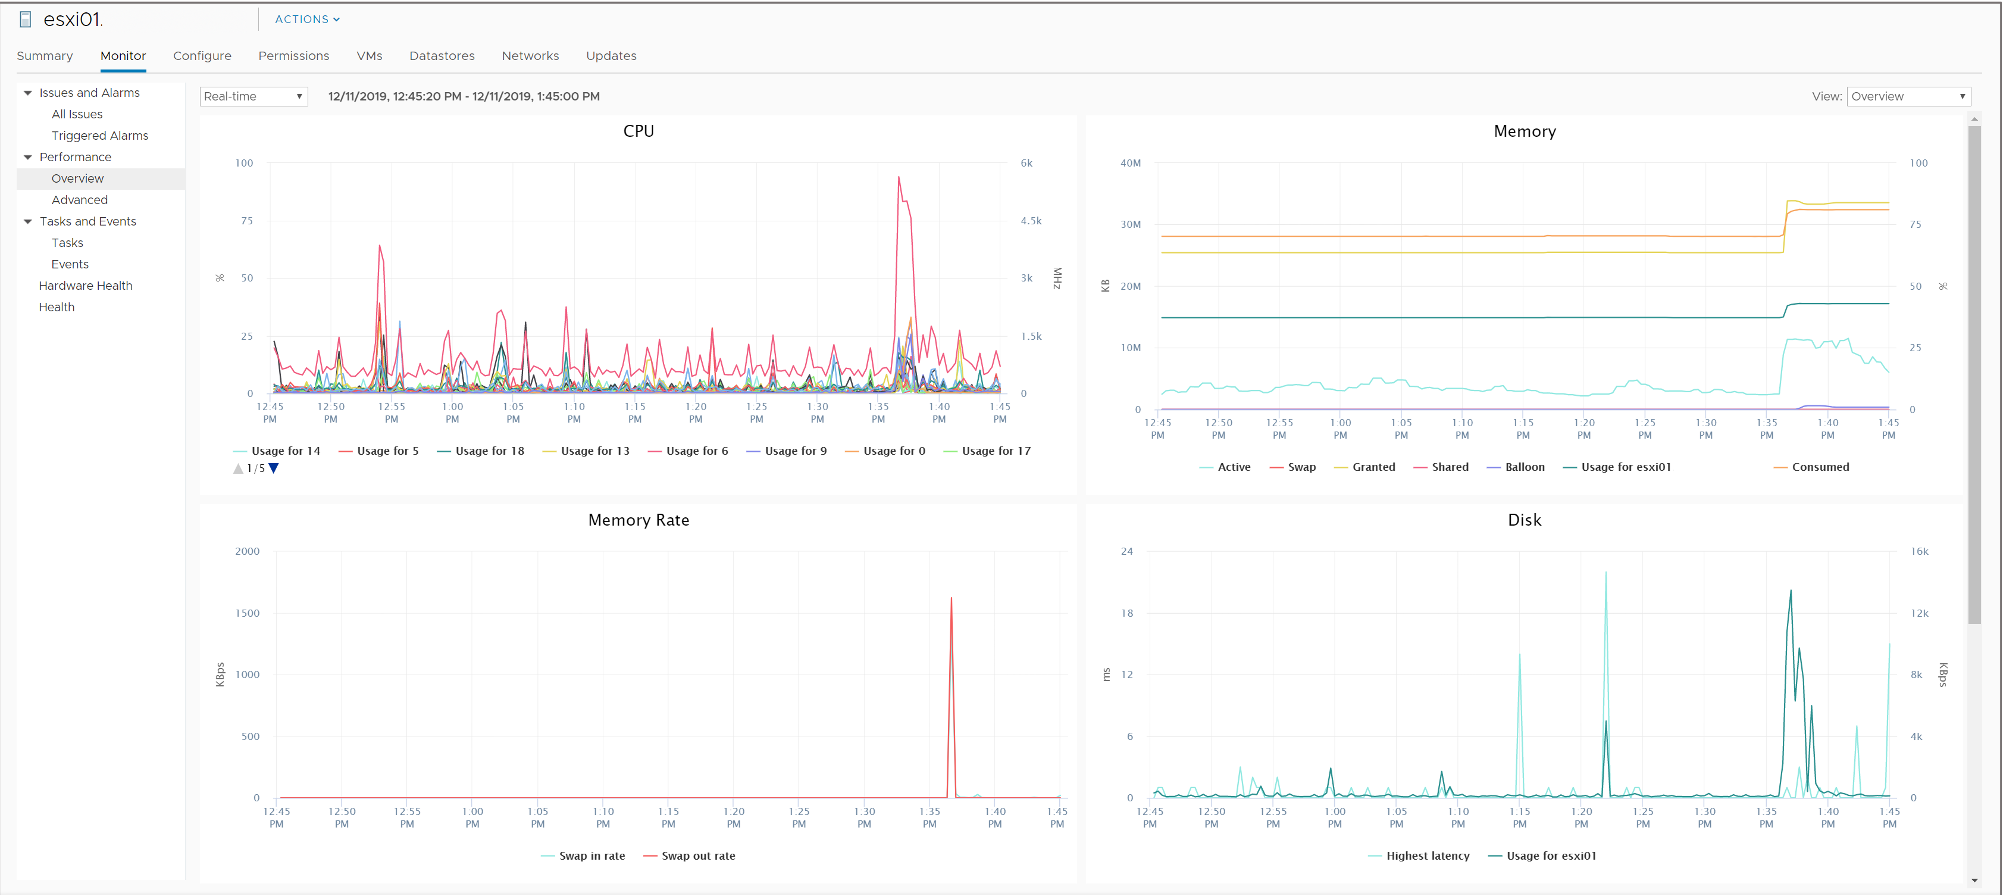
Working with Overview Performance Charts
The overview performance charts display the most common metrics for an object in the inventory.
Working with Advanced Performance Charts
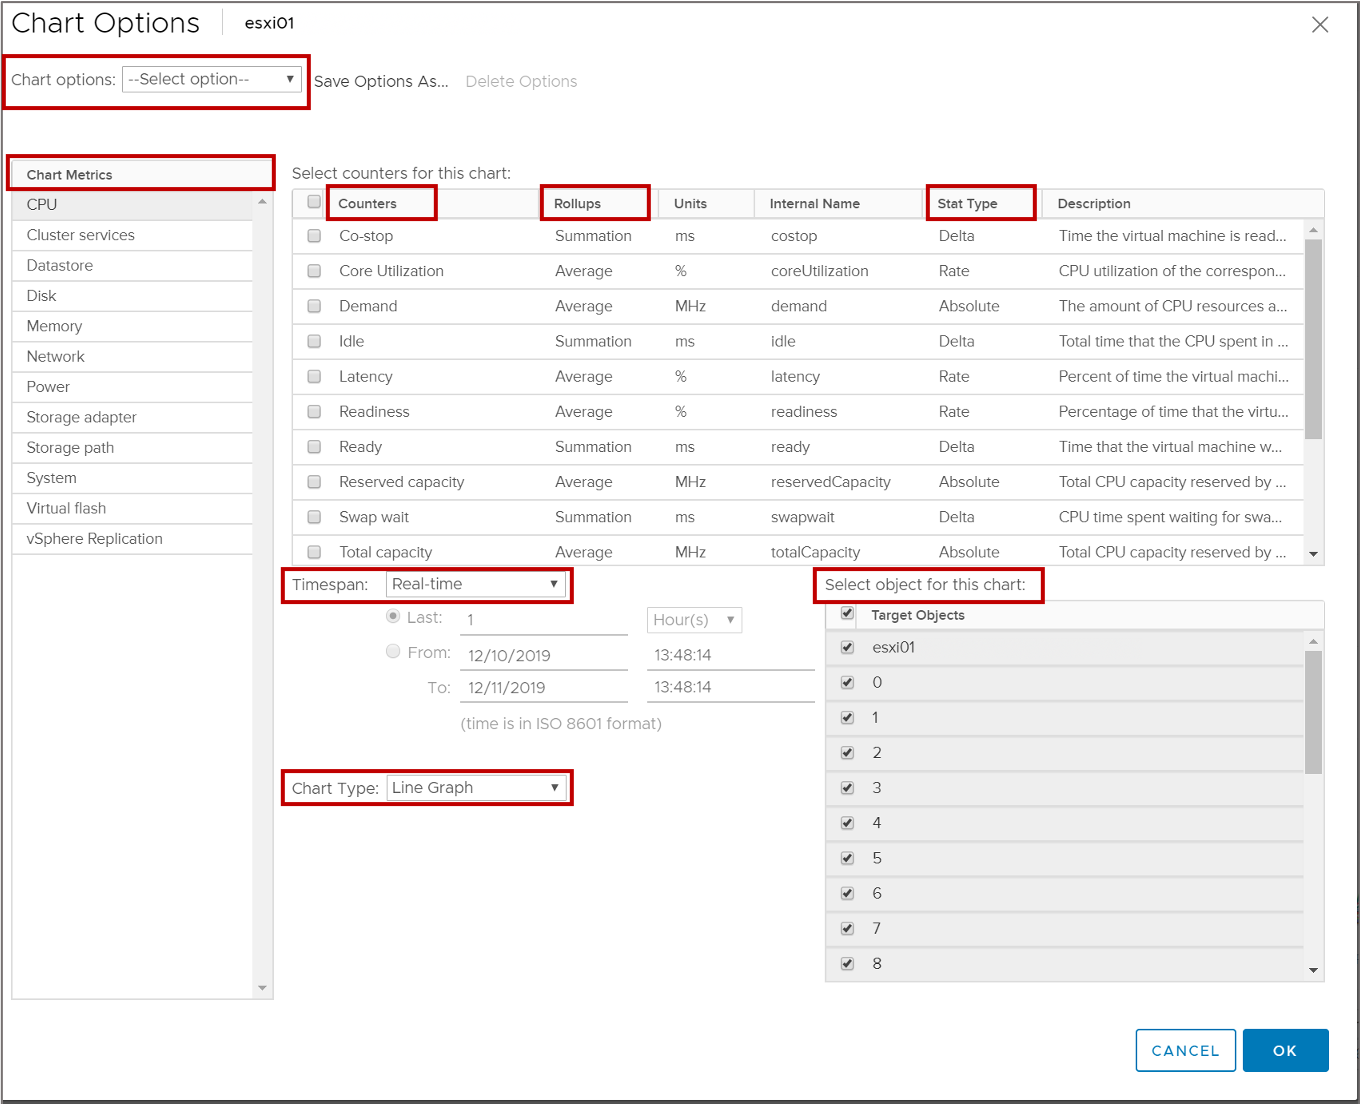 Advanced charts support data counters that are not supported in other performance charts.
Chart Options: Real-Time and Historical
vCenter Server stores statistics at different specificities.
| Time Interval | Data Frequency | Number of Samples |
| Real-time (past hour) | 20 seconds | 180 |
| Past day | 5 minutes | 288 |
| Past week | 30 minutes | 336 |
| Past month | 2 hours | 360 |
| Past year | 1 day | 365 |
Chart Types: Bar and Pie
Depending on the metric type and object, performance metrics are displayed in different types of charts, such as bar charts and pie charts. 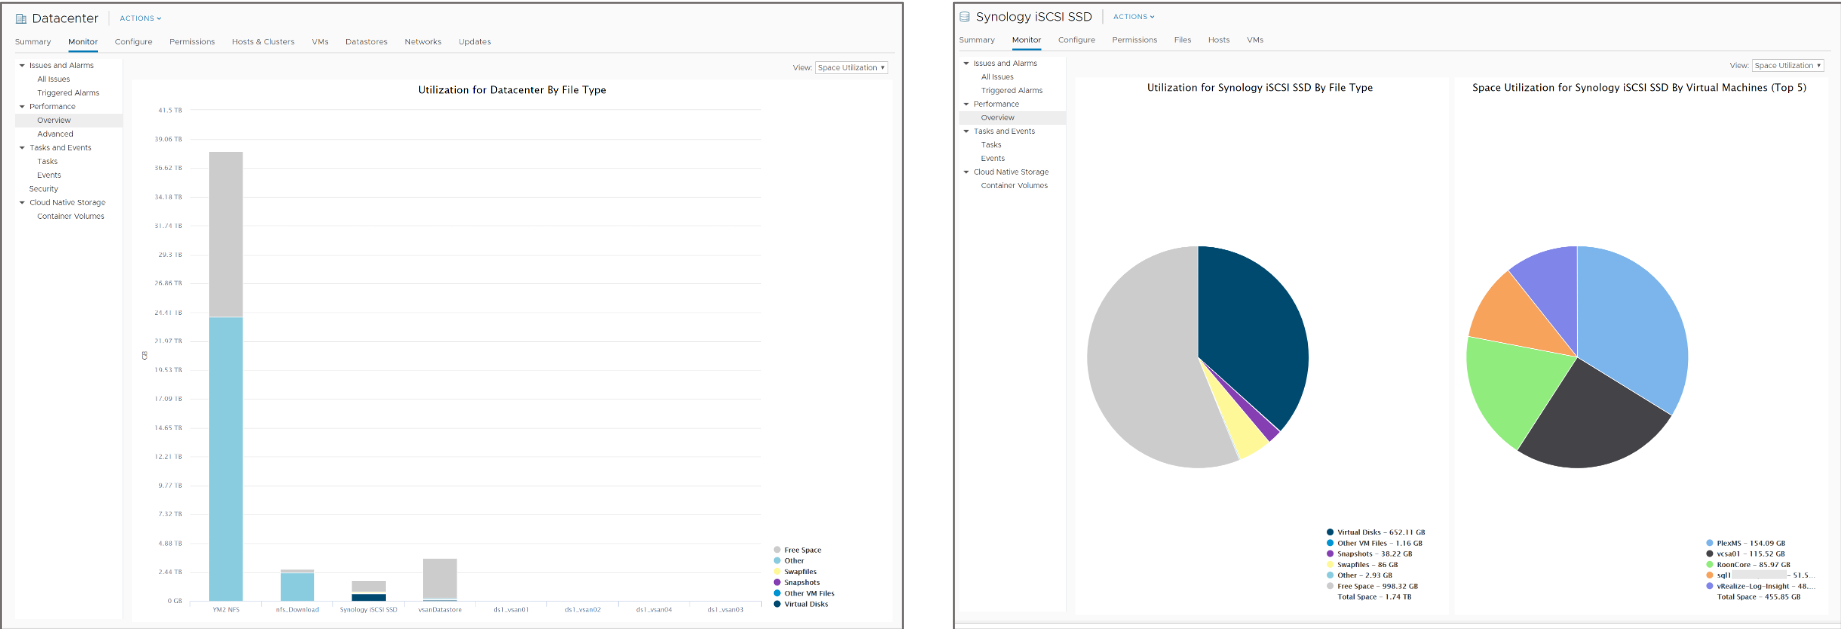
Chart Types: Line
A line chart displays metrics for a single inventory object, for example, metrics for each CPU on an ESXi host. 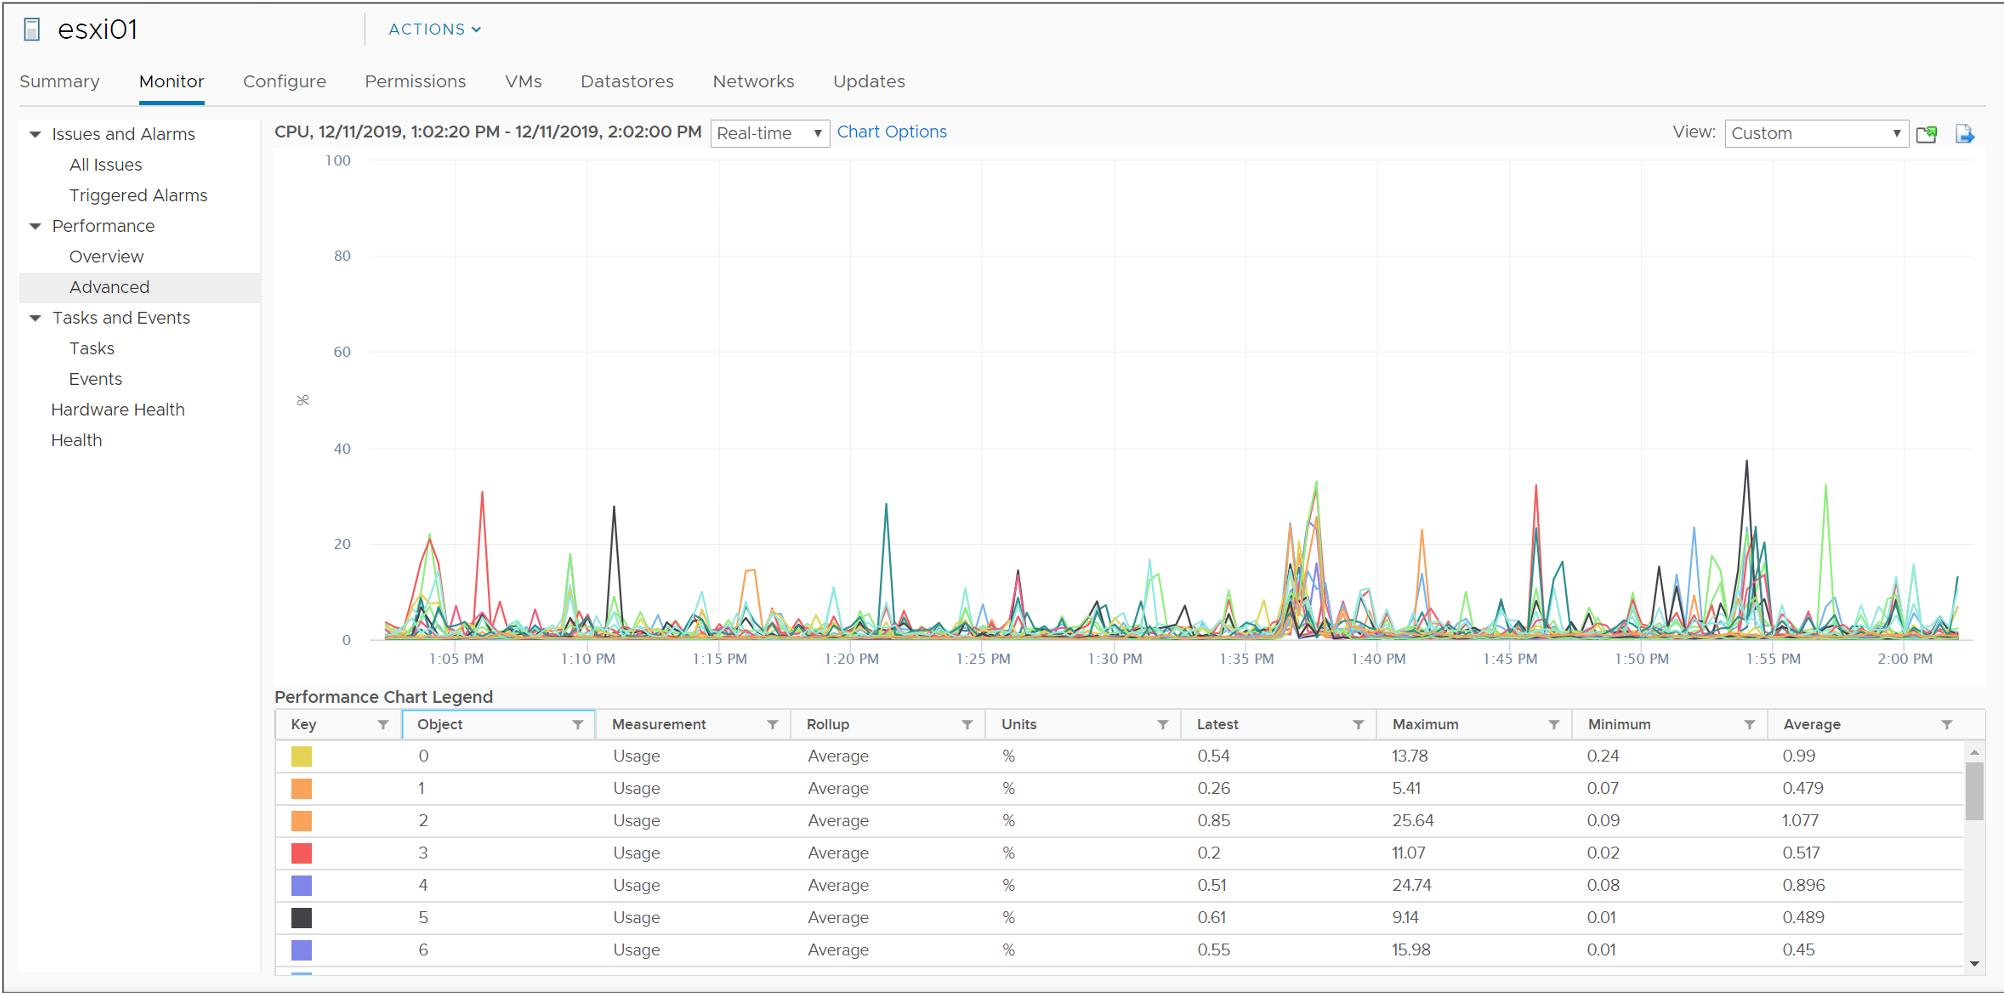
Chart Types: Stacked
Stacked charts are useful for comparing resource allocation and usage across multiple hosts or VMs. 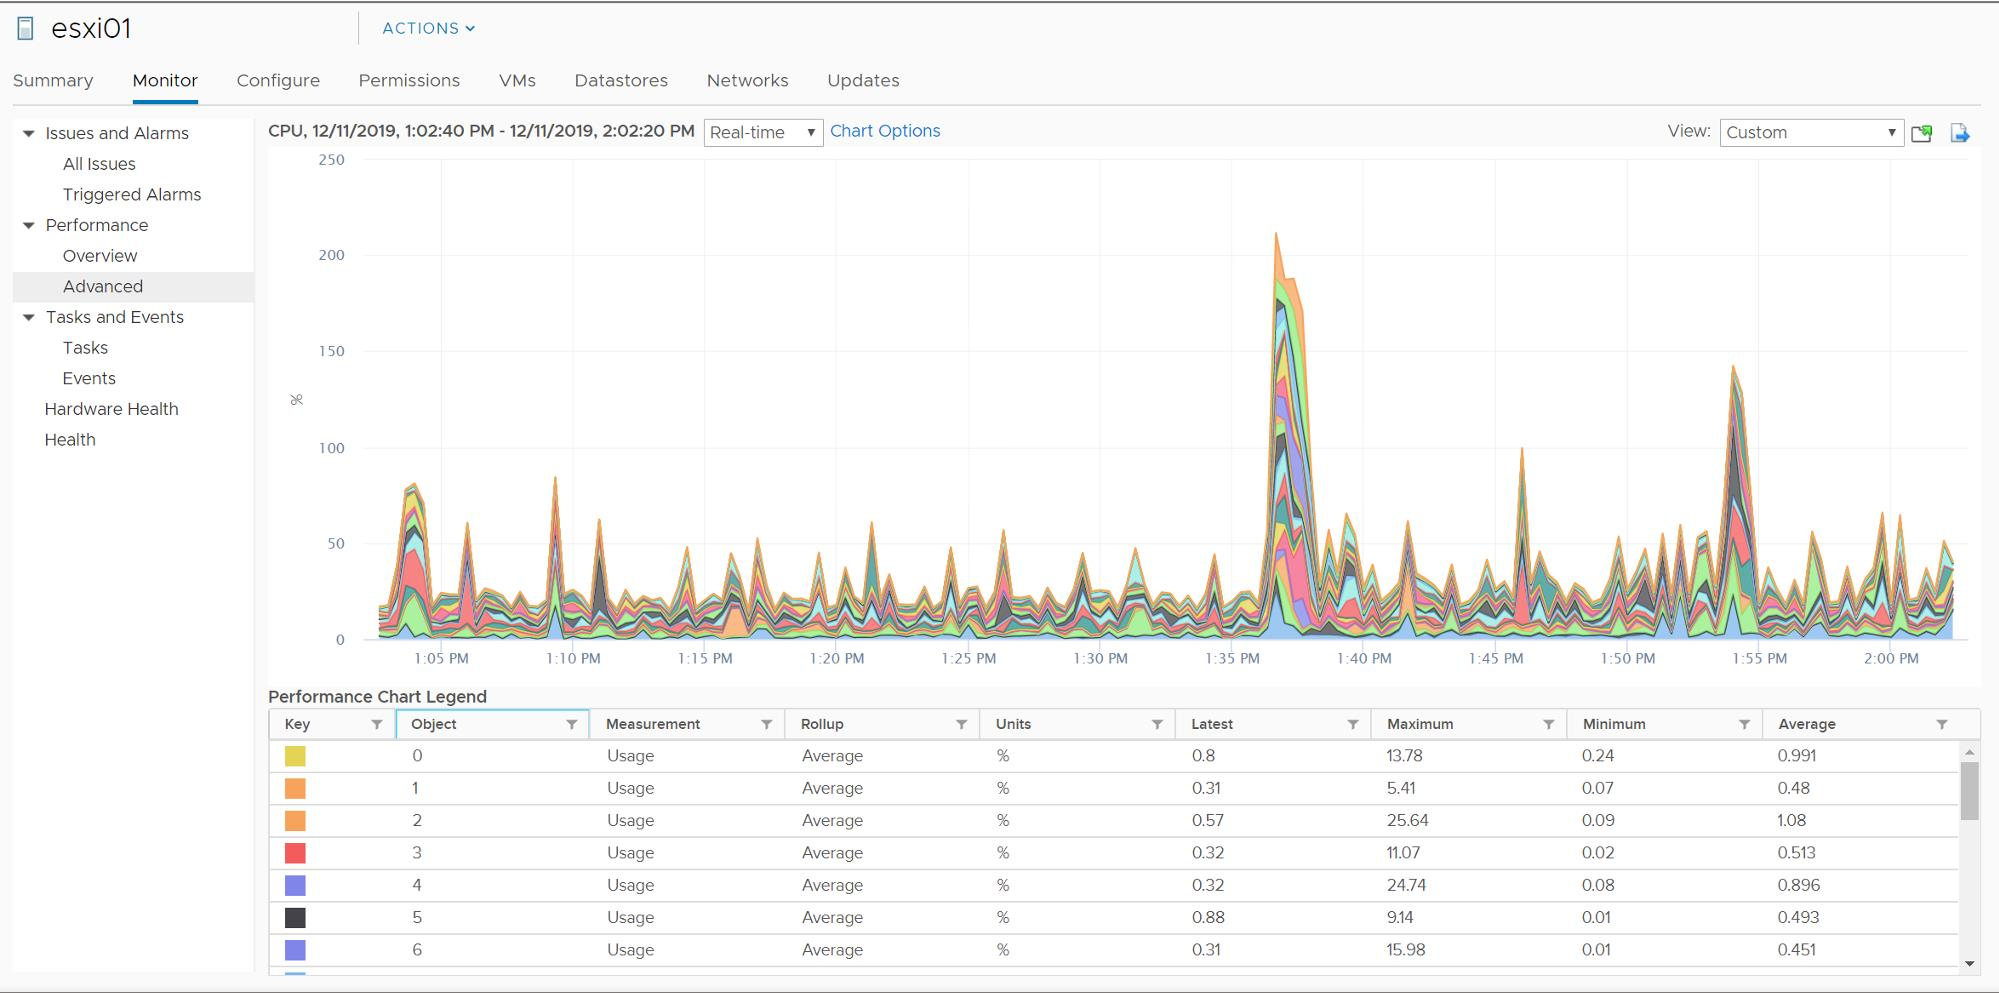
Chart Types: Stacked Per VM
Per-VM stacked graphs are available only for hosts. 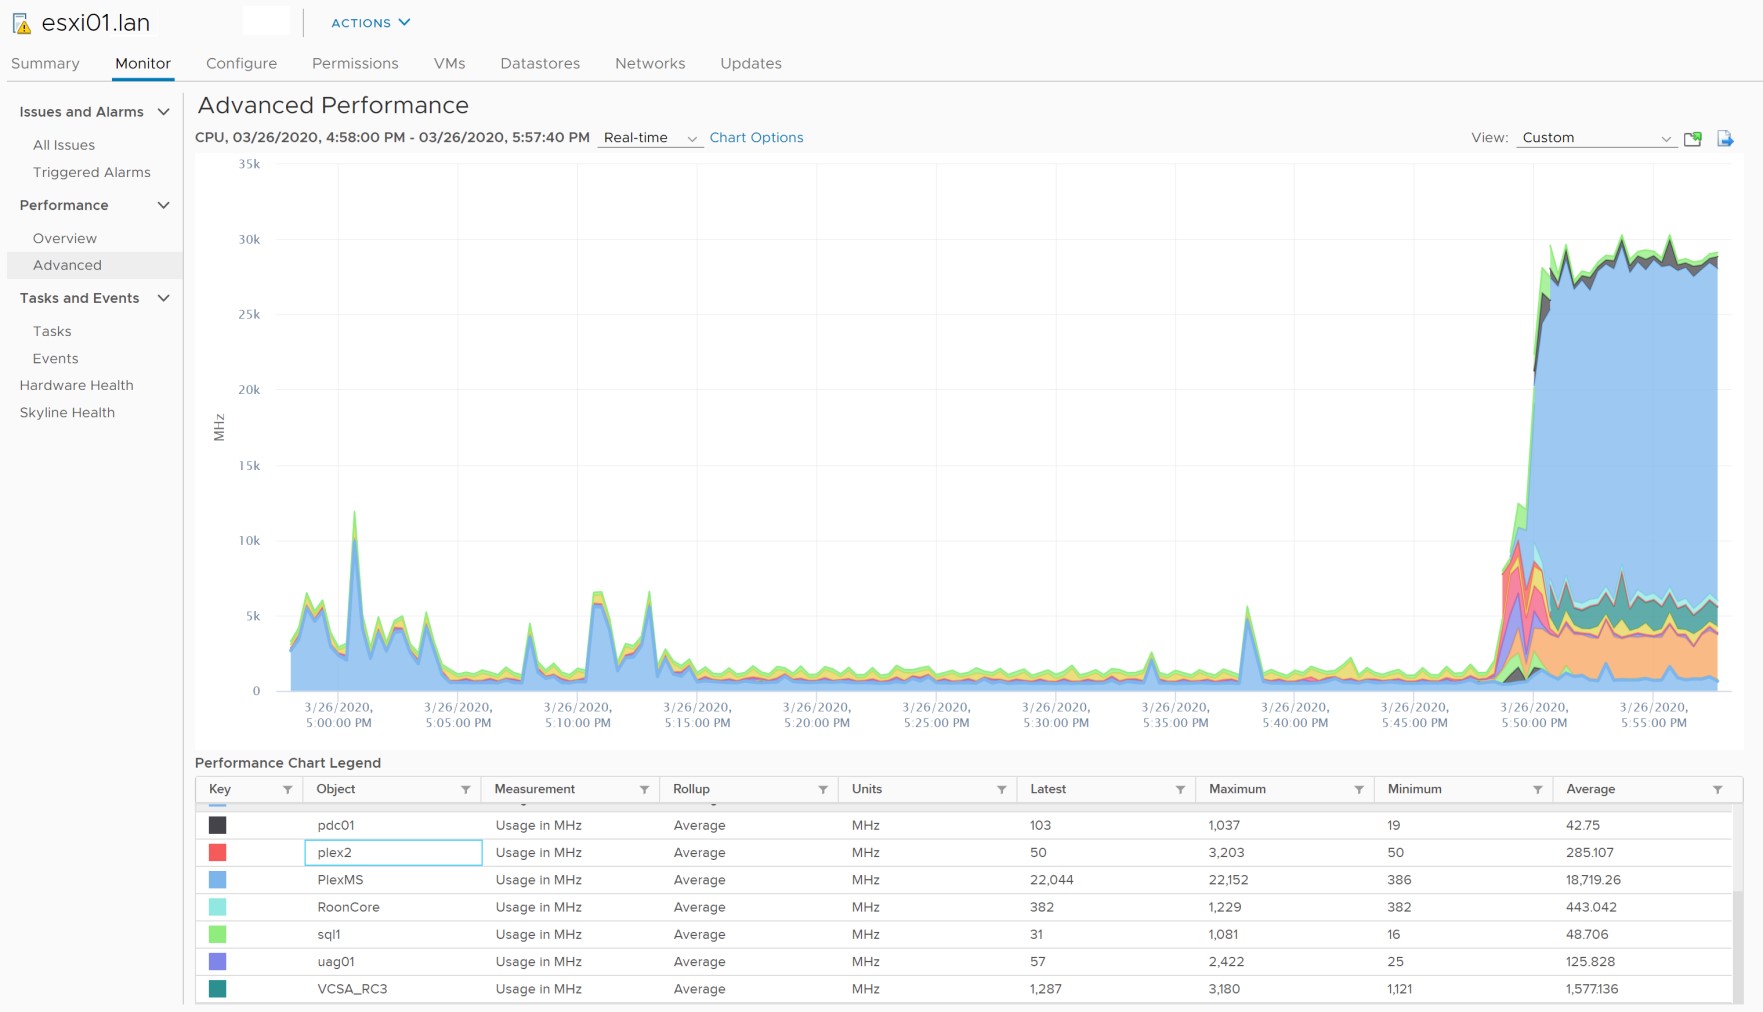
Saving Charts
You click the Save Chart icon above the graph to save performance chart information. You can save information in PNG, JPEG, SVG, and CSV formats. 
About Objects and Counters
Performance charts graphically display CPU, memory, disk, network, and storage metrics for devices and entities managed by vCenter Server. Objects are instances or aggregations of devices: Examples:
- vCPU0
- vCPU1
- vmhba1:1:2
- Aggregation over all NICs
Counters identify which statistics to collect: Examples:
- CPU: Used time, ready time, usage (%)
- NIC: Network packets received
- Memory: Memory swapped
About Statistics Types
The statistics type is the unit of measurement that is used during the statistics interval.
| Statistics Type | Description | Example |
| Rate | Value over the current interval | CPU use (MHz) |
| Delta | Change from previous interval | CPU ready time |
| Absolute | Absolute value, independent of interval | Memory active |
About Rollup
Rollup is the conversion function between statistics intervals:
- 5 minutes of past-hour statistics are converted to one past-day value:
- – Fifteen 20-second statistics are rolled up into a single value.
- 30 minutes of past-day statistics are converted to 1 past-week value: – Six 5-minute statistics are rolled up into a single value.
| Rollup Type | Conversion Function | Sample Statistic |
| Average | Average of data points | CPU use (average) |
| Summation | Sum of data points | CPU ready time (milliseconds) |
| Latest | Last data point | Uptime (days) |
| Minimum | Current or average minimum data point | Available in all counters when vCenter Server statistics collection is set to level 4 |
| Maximum | Current or average maximum data point |
Review of Learner Objectives
After completing this vSphere Resource Monitoring Tools lesson, you should be able to meet the following objectives:
- Describe the performance-tuning methodology
- Identify resource-monitoring tools
- Use vCenter Server performance charts to view performance