Debugging
describes the value of using debugging as a troubleshooting tool and provides basic configuration examples.
• One of the most common use cases for debugging is when there is a need to see things at a deeper level (such as when routing protocols are having adjacency issues).
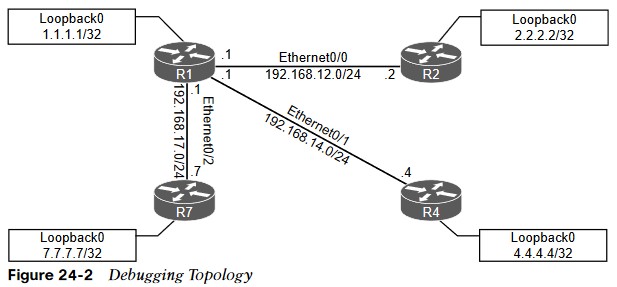
Debugging Topology
debugging is used to fix a couple issues in the OSPF area 0.
OSPF Adjacency Issues
- Some of the common OSPF adjacency issues such as MTU issues, incorrect interface types, and improperly configured network mask can be resolved by using debugging.
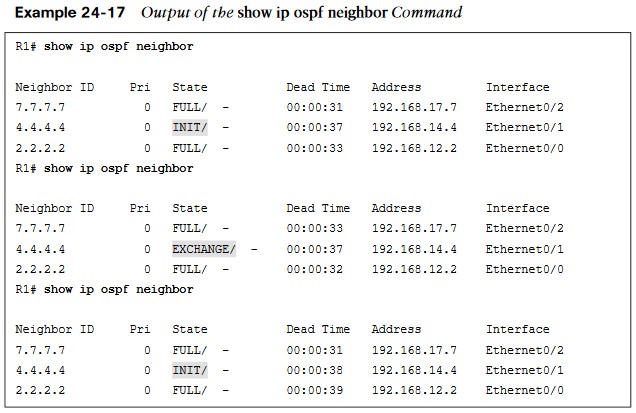
- The neighbor adjacency to R4 is in the INIT state. If the command is run after a few seconds, the state changes to EXCHANGE but quickly cycles back to the INIT state when the command is run again.
Output of Debug IP OSPF ADJ Command
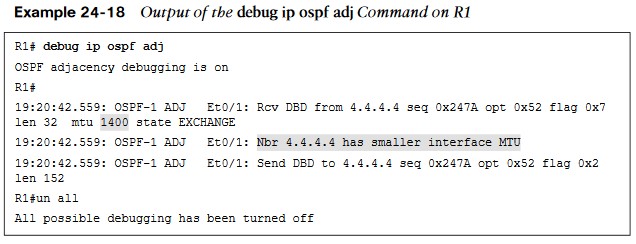
- Debugging is used on R1 to try to determine what the issue is. This command is used to reveal messages that are exchanged during the OSPF adjacency process.
- The output of the debug ip ospf adj command in Example 24-18 clearly states that it received a Database Descriptor packet from the neighbor 4.4.4.4, and that 4.4.4.4 has a smaller interface MTU of 1400.
Output of Debug IP OSPF ADJ Command
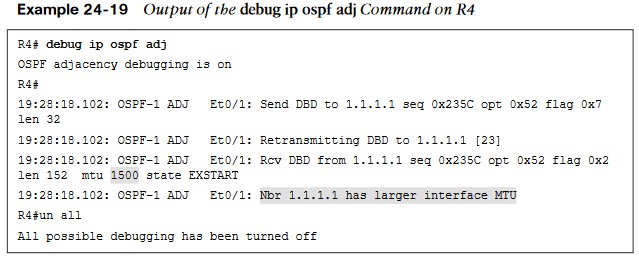
- The output shows that R1 has an MTU size of 1500, which is larger than the locally configured MTU of 1400 on R4. This is a really quick way of troubleshooting this type of issue with adjacency formation
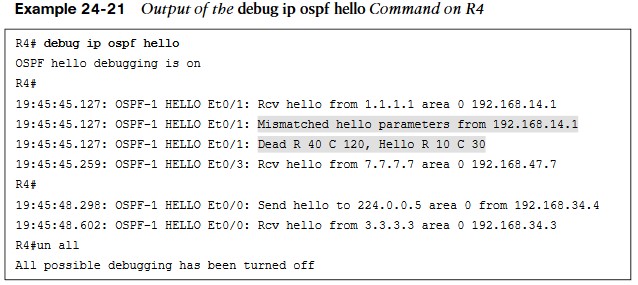
Output of the Debug IP OSPF Hello Command

- The issue with OSPF network type mismatch, which is a very common reason for neighbor adjacency issues. Often this is simply a misconfiguration issue when setting up the network.
- When the debug ip ospf hello command is used on R1, everything appears to be normal: Hellos are sent to the multicast group 224.0.0.5 every 10 seconds.
Output of the Debug IP OSPF Hello Command
- Based on the output, we can see that the hello parameters are mismatched. The output shows that R4 is receiving a dead interval of 40, while it has a configured dead interval of 120. We can also see that the hello interval R4 is receiving is 10, and the configured hello interval is 30. By default, the dead interval is 4 times the hello interval.
Hello and Dead Intervals
Different network types have different hello intervals and dead intervals. Table 24-4 high-lights the different hello and dead interval times based on the different OSPF network types.
| Network Type | Hello Interval (in seconds) | Dead Interval (in seconds) |
| Broadcast | 10 | 40 |
| Non-broadcast | 30 | 120 |
| Point-to-point | 10 | 40 |
| Point-to-Multipoint | 30 | 120 |
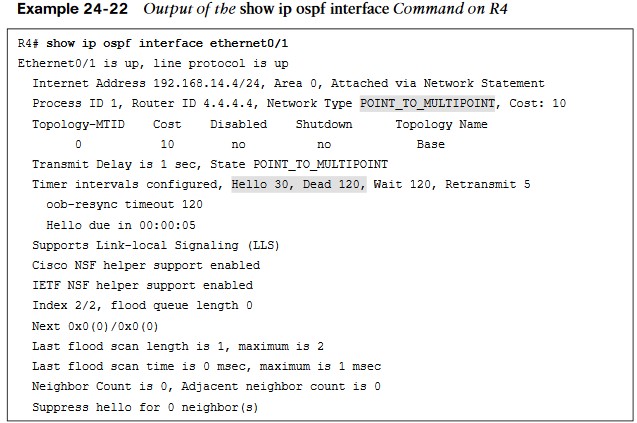
Output of the Show IP OSPF Interface
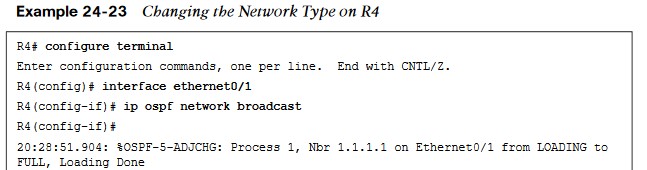
Changing the Network Type
- Simply changing the network type on R4 interface Ethernet0/1 back to the default of Broadcast fixes the adjacency issue in this case. This is because R1 is configured as Broadcast, and now the hello and dead intervals will match.
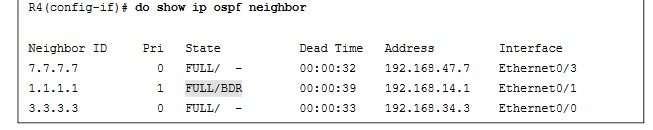
- Example 24-23 shows the ip ospf network-type broadcast command issued to change the network type to Broadcast on the Ethernet0/1 interface and the neighbor adjacency coming up. It is also verified with the do show ip ospf neighbor.
Show and Debug Commands on R1
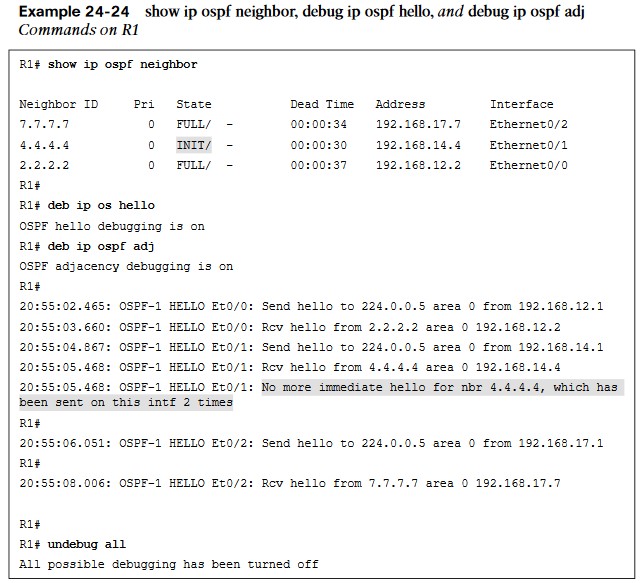
- The final use case for using debugging to solve OSPF adjacency issues involves improper configuration of IP addresses and subnet masks on an OSPF interface.
- To troubleshoot this without having to look through running configurations or at a specific interface, use the debug ip ospf hello.
- It indicates that there is no OSPF adjacency to R4 when there certainly should be one.
Ping
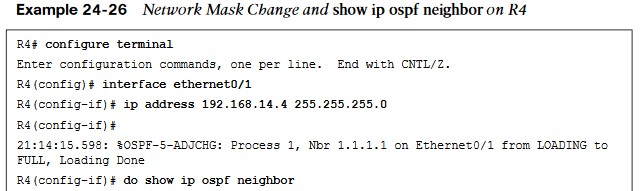
- The network mask on the Ethernet0/1 interface of R4 needs to be changed to match the one that R1 has configured and is sending to R4 through OSPF hellos.
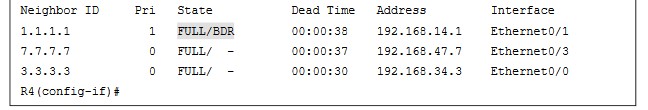
- Example 24-26 shows the network mask being changed on the R4 Ethernet0/1 interface and the OSPF adjacency coming up. This is then verified with the do show ip ospf neighbor.
Conditional Debugging
- Conditional debugging can be used to limit the scope of the messages that are being returned to the console or syslog server. A great example of this is the debug ip packet command. Issuing this command on a router that is in production could send back a tremendous number of messages.
- One way to alleviate this issue is to attach an access list to the debug command to limit the scope of messages to the source or destination specified within the access list.
- The options for the debug ip packet command are as follows:
- <1-199>: Standard access list
- <1300-2699>: Access list with expanded range
- detail: More debugging detail
SNMP
- The typical tool for reactive alerting from network devices.
- SNMP sends unsolicited traps to an SNMP collector/NMS. These traps are in response to something that happened in the network.
- For example, traps may be generated for link status events, improper user authentication, power supply failures. These events defined in the SNMP MIB.
- The MIB can be thought of as a repository of device parameters that can be used to trigger alerts.
SNMP Versions
| Version | Level | Authentication | Encryption | Result |
| SNMPv1 | noAuthNoPriv | Community string | No | Uses a community string match for authentication. |
| SNMPv2c | noAuthNoPriv | Community string | No | Uses a community string match for authentication. |
| SNMPv3 | noAuthNoPriv | Username | No | Uses a username match for authentication. |
| SNMPv3 | authNoPriv | Message Digest 5 (MD5) or Secure Hash Algorithm (SHA) | No | Provides authentication based on the HMAC-MD5 or HMAC-SHA algorithms. |
| Version | Level | Authentication | Encryption | Result |
| SNMPv3 | authPriv (requires the cryptographic software image) | MD5 or SHA | Yes | Provides authentication based on the HMAC-MD5 or HMAC-SHA algorithms. Allows specifying the User-based Security Model (USM) with these encryption algorithms:DES 56-bit encryption in addition to authentication based on the CBC-DES (DES-56) standard.3DES 168-bit encryptionAES 128-bit, 192-bit, or 256-bit encryption |
SNMP Operations
| Operation | Description |
| get-request | Retrieves a value from a specific variable |
| get-nextrequest | Retrieves a value from a variable within a table |
| get-bulkrequest | Retrieves large blocks of data, such as multiple rows in a table |
| get-response | Replies to a get request, get next request, and set request sent by an NMS |
| set-request | Stores a value in a specific variable |
| trap | Sends an unsolicited message from an SNMP agent to an SNMP manager when some event has occurred |
- SNMPv1 and SNMPv2c use access lists and a community password or string.
- These community strings can be read-only (RO) or read/write (RW). It is critical to limit SNMP access to these devices by using access lists.
- By default, if no version is specified in configuration, SNMPv1 is used. However, to better show how SNMP works, this chapter focuses on SNMPv2c.
MIBs
It is important to look at a MIB to understand some of the information or values that can be polled or send traps from SNMP. The SNMPv2-MIB.my file shows what values can be polled in the MIB and to illustrate sending traps from SNMP. To see a list of available Cisco MIBs, visit https://mibs.cloudapps.cisco.com/ITDIT/MIB S/servlet/index. Although configuring an NMS is not covered in this chapter, the device side that points to an NMS is covered in this section. The following list shows a handful of measures involved in setting up SNMP on a device to allow the device to be polled and send traps to an NMS:
- Define the SNMP host or the NMS to send traps to
- Create an access list to restrict access via SNMP
- Define the read-only community string
- Define the read/write community string
- Define the SNMP location
- Define the SNMP contact
- These settings do not need to be configured in any particular order. It is best practice to configure the access list first and then the read-only and read/write strings to have security in place.
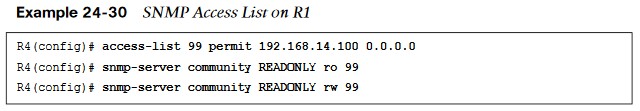
- On R1, a standard access list is configured to only permit access from an NMS host on the 192.168.14.0/24 subnet, 192.168.14.100. Once the access list is configured, the read-only and read/write community strings are configured and bound to that access list.
- It is important to try to use SNMP strings that are not easy to guess from a security perspective.
- At this point, the device is configured to be polled from an NMS host with the IP address 192.168.14.100.
SNMP Traps
To send SNMP traps to an NMS, traps first must be enabled on the device. All available traps can be enabled by issuing the snmp-server enable traps command.
- However, this may enable unnecessary traps that have no significance to the network operations team. It might be more appropriate to be selective about which traps to enable.
- The traps that are available to be enabled is platform specific.
- A common approach to determining what traps are available is to look at the documentation for the device. It may be easier to simply issue the snmp-server enable traps command followed by ? to leverage the context-sensitive help and determine what traps are available on the device.
A significant number of traps can be enabled to send to an NMS.
Syslog
- Devices can generate useful information to the console, to the logging buffer, and to off-box syslog collectors. In fact, all three can be sent the same or different message types.
- It is critical to note that prior to configuring any device to send log information, the date and time of the clock must be properly configured for accurate time.
| Level Keyword | Level | Description | Syslog Definition |
| emergencies | 0 | System unstable | LOG_EMERG |
| alerts | 1 | Immediate action needed | LOG_ALERT |
| critical | 2 | Critical conditions | LOG_CRIT |
| errors | 3 | Error conditions | LOG_ERR |
| warnings | 4 | Warning conditions | LOG_WARNING |
| notifications | 5 | Normal but significant conditions | LOG_NOTICE |
| informational | 6 | Informational messages only | LOG_INFO |
| debugging | 7 | Debugging message | LOG_DEBUG |
Syslog (Cont.)
- Having syslog configured doesn’t mean that an issue will be found. It still takes the proper skill to be able to look at the messages and determine the root cause of the issue.
- The logging buffer is the first area to focus on. You can enable logging to the buffer as follows:
- Enable logging to the buffer.
- Set the severity level of syslog messages to send to the buffer.
- Set the logging buffer to a larger size.
- The logging buffered ? command is issued from the global configuration mode to see the available options. It is important to note that the severity level can be configured by simply specifying the level with a number from 0 to 7 or the name of the severity (listed next to the severity level number).
- The default size of the logging buffer is 4096 bytes.
- This can get overwritten quite quickly. It is good practice to expand the buffer size so you can capture more logging information.
Logging Buffer Size and Severity Level
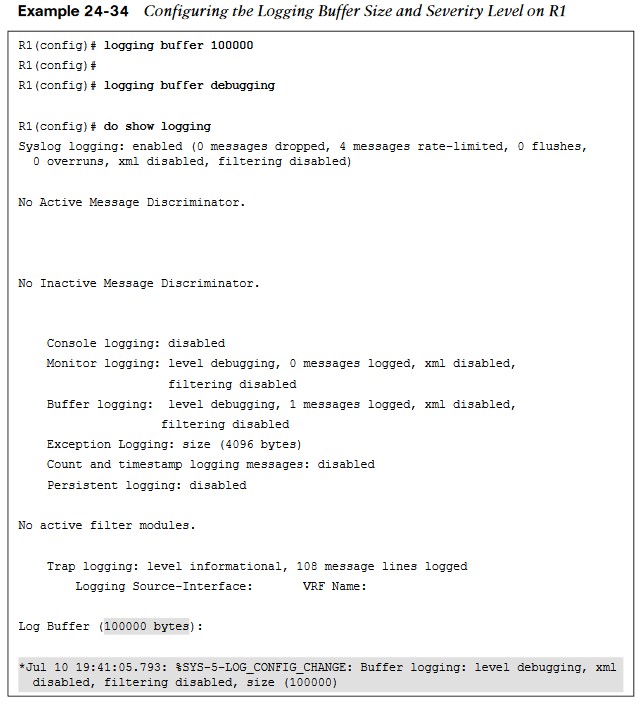
- Debugging or severity 7 is the level that will be configured in this example; with this configuration, any debugging can be sent to the logging buffer instead of the console.
Sending Logging to a Host for Debugging
Sending these same logs to an off-box collector, that could be configured as well. By default, these messages are sent to the logging host through UDP port 514, but this can be changed if necessary. Configuring logging to a host is very similar to configuring logging on the console or buffer. In this case, it is configured by using the following steps:
- Enable logging to host 192.168.14.100.
- Set the severity level of syslog messages to send to host.
Syslog can be used to notify of power supply failures, CPU spikes, and a variety of other things. It is important not to underestimate the level of granularity and detail that can be achieved by setting up proper notification policies in a network. It is ultimately up to the network operations team to determine how deep is appropriate to meet the business’s needs.